
Current Trading Mood

Source: X
Last week was another rollercoaster ride in asset markets, though the market saw a decent bounce on Thu/Fri after registering extreme oversold readings on various technicals (CBOE put-call ratios spiked to the highest levels since last summer). Limited tariff and geopolitical news (for now), an averted US government shut-down, and extreme over-old readings on US equities provided the stage for a 2%+ bounce on Friday, albeit on low volumes.
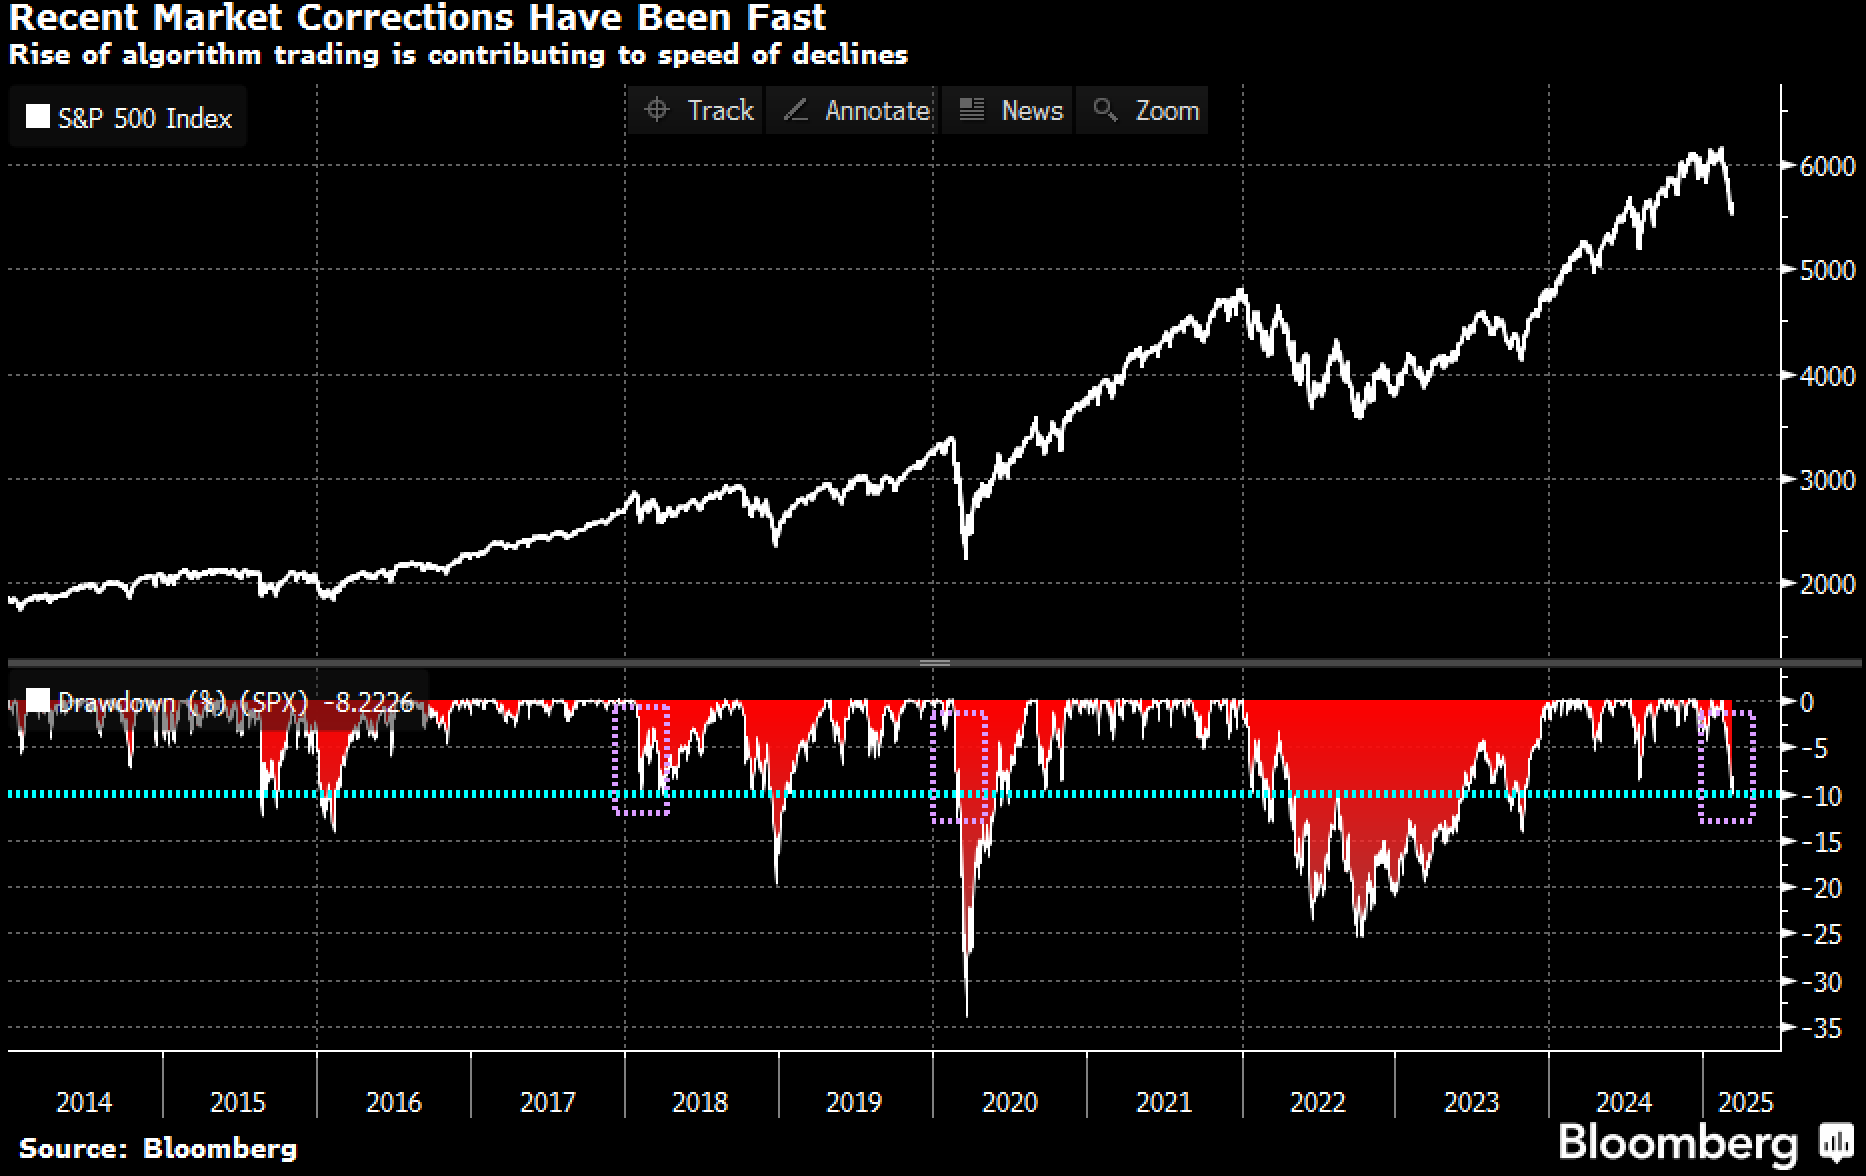
According to Bloomberg, it took only 16 days for SPX to fall >10% from its recent peak, citing the proliferation of automated trading systems and strict risk-management limits. Market corrections have been increasingly fast and sudden as technology advances, with the last 3 recent major sell-offs (Vol-crash 2018, Covid 2020, and Tariff 2025) registered as some of the sharpest retracements on record.
The Sell-Offs are Happening Faster and Faster and Capital Markets Continue to Advance
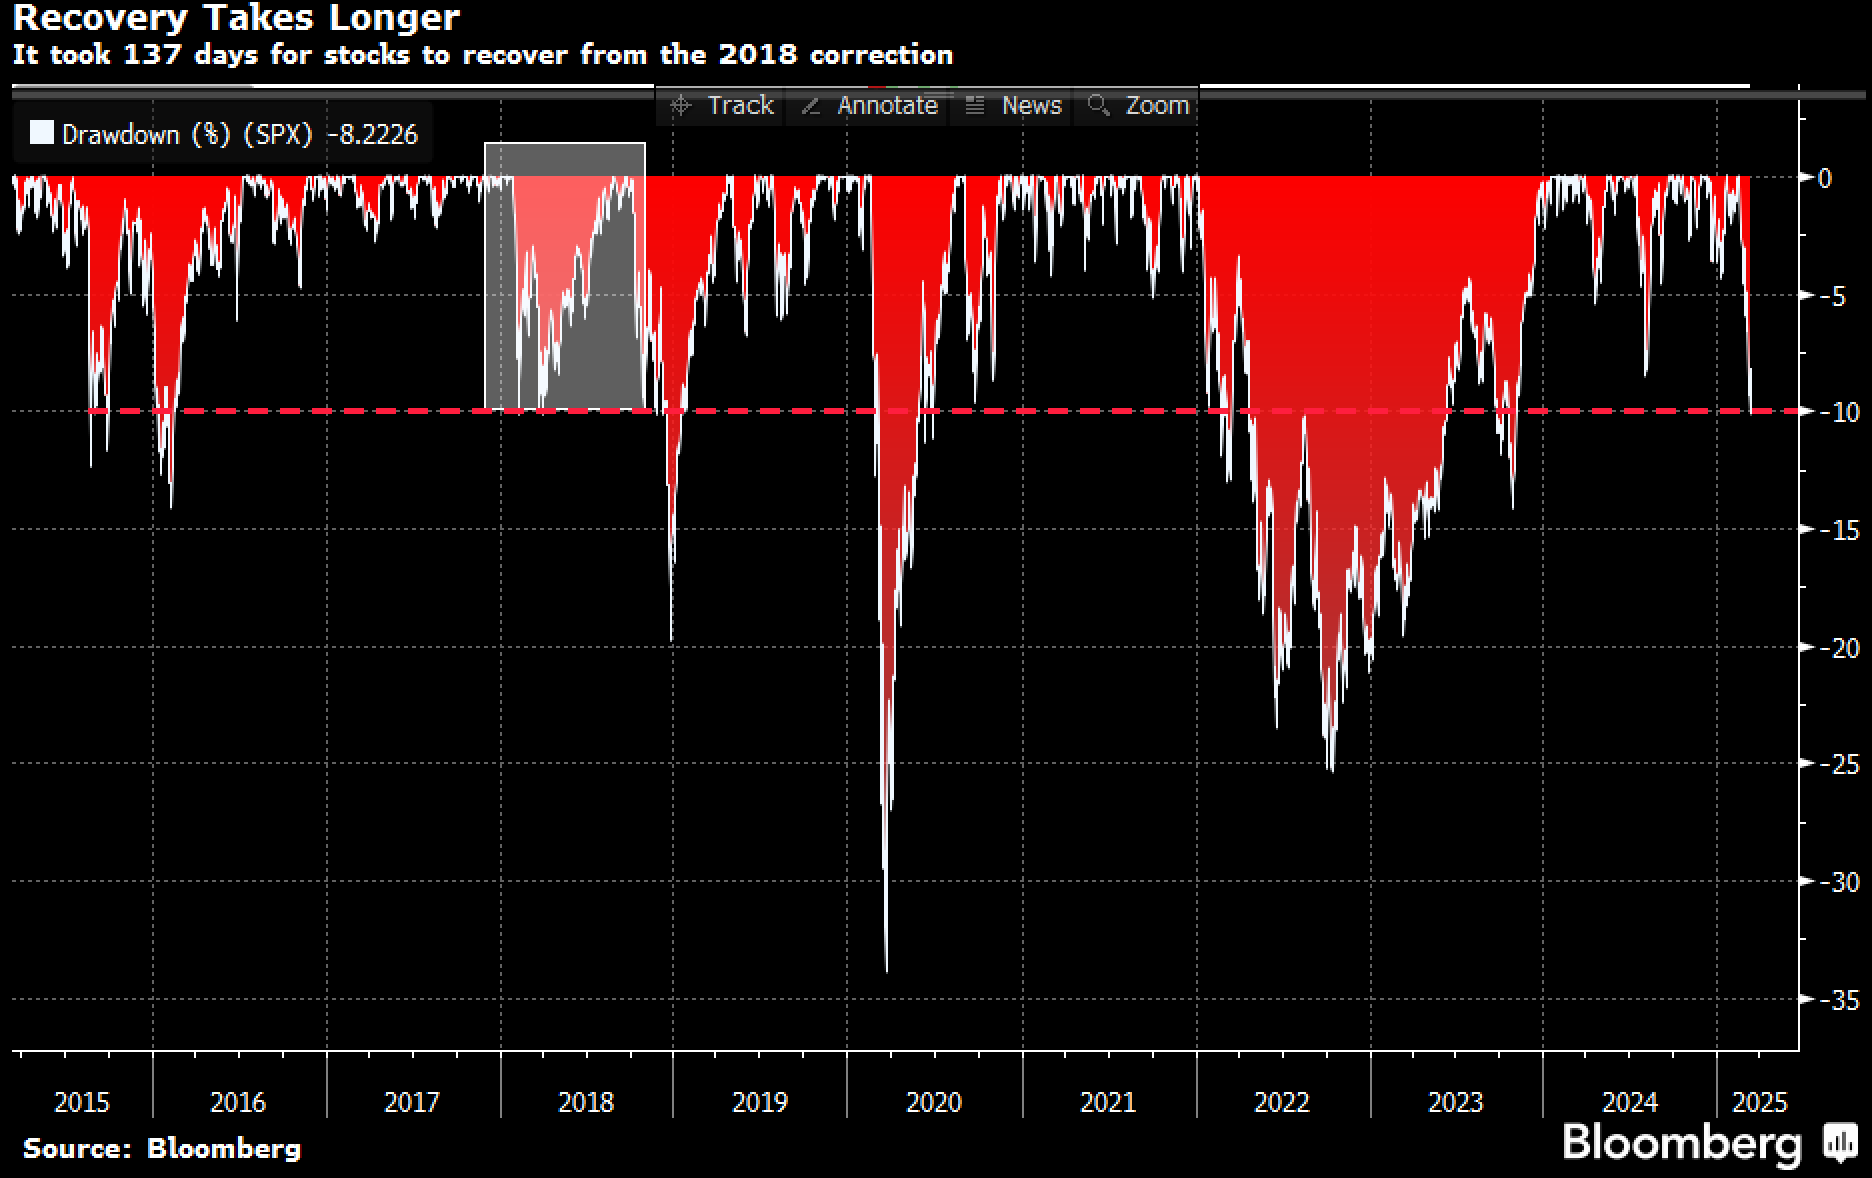
On the contrary, recoveries have generally taken longer as modern money managers are extremely risk-constrained. The 2018 sell-off took just under 2 weeks for the SPX to correct 10%, while needing nearly 4.5 months to recover those losses to break-even. Bloomberg cites that over the past 24 instances where stocks have sold off more than 10%, the average recovery time has been ~8 months, reflecting the idiom that markets tend to ‘take the stairs up, but the elevator down’ on price movements.
What Comes Down… Tends to Take a While to Go Back Up…
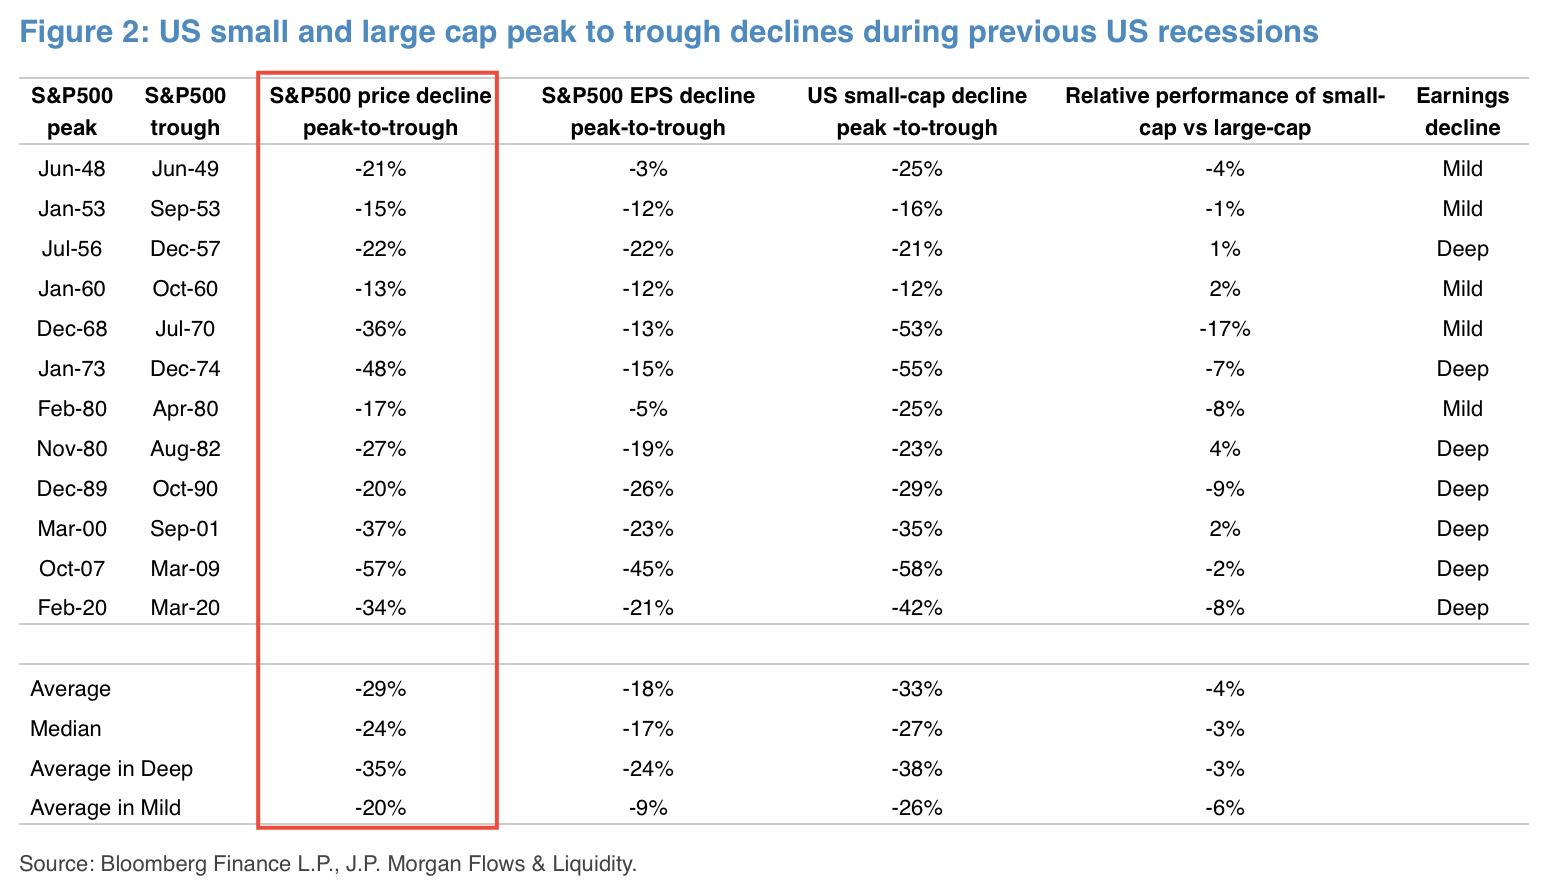
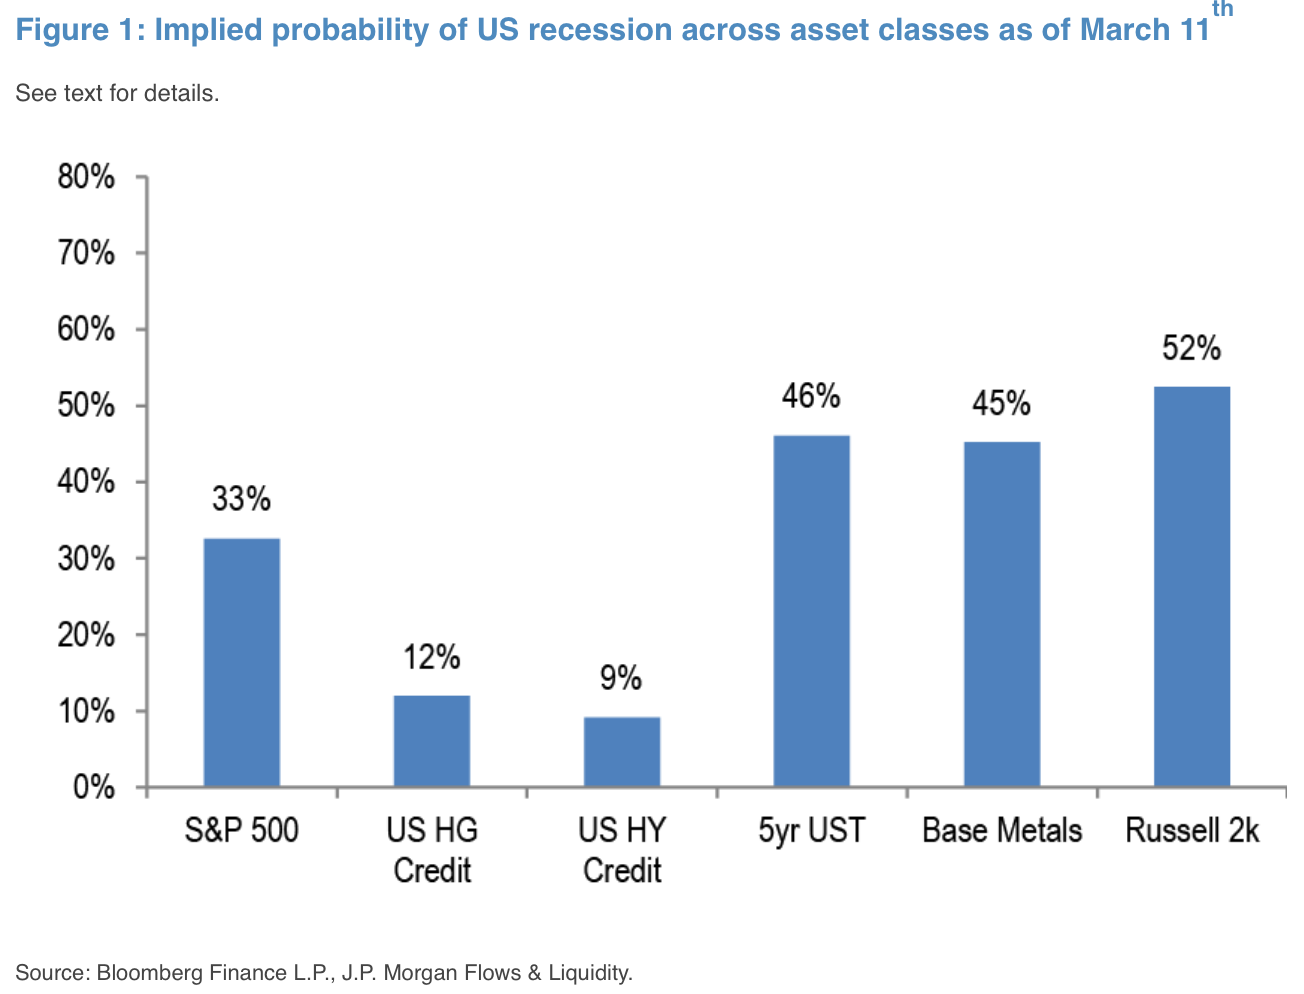
Furthermore, according to JPM, the last 12 US recessions saw US equities correct by ~30% on a peak-to-trough basis, versus 9.5% for the SPX at the current time. A simple extrapolation would suggest that equity markets are not pricing in ~33% chance of a recession, with commodities & treasuries suggesting close to a 50% chance, while credit coming in on the other end at just 10%.
Prior US Recessions have Seen the SPX Correct by an Average of 30% on a Peak to Trough Basis
Source: JPM
Different Asset Classes Pricing in Substantially Different Odds of a US Recession
Source: JPM
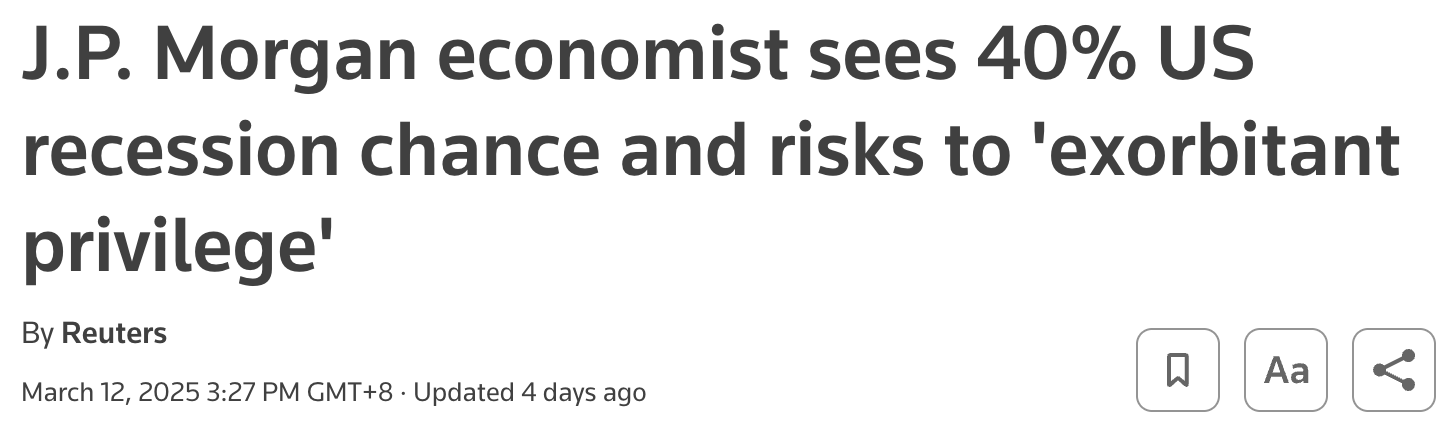
While asset classes are still trying to find their footing, Wall Street economists have pre-empted the moves with GS as the first major investment bank to slash US GDP forecasts for 2025. GDP forecast was drastically cut to 1.7% from 2.4%, “the reason for the downgrade is that our trade policy assumptions have become considerably more adverse” as tariff impacts grow. Similarly, JPM raised recession risk to 40%, and cited risks to the US’s ‘exorbitant privilege’ of finding its rising deficit profile against low funding rates, high capital flows and attractive dollar-based assets.
And Down Goes the GDP Forecasts…
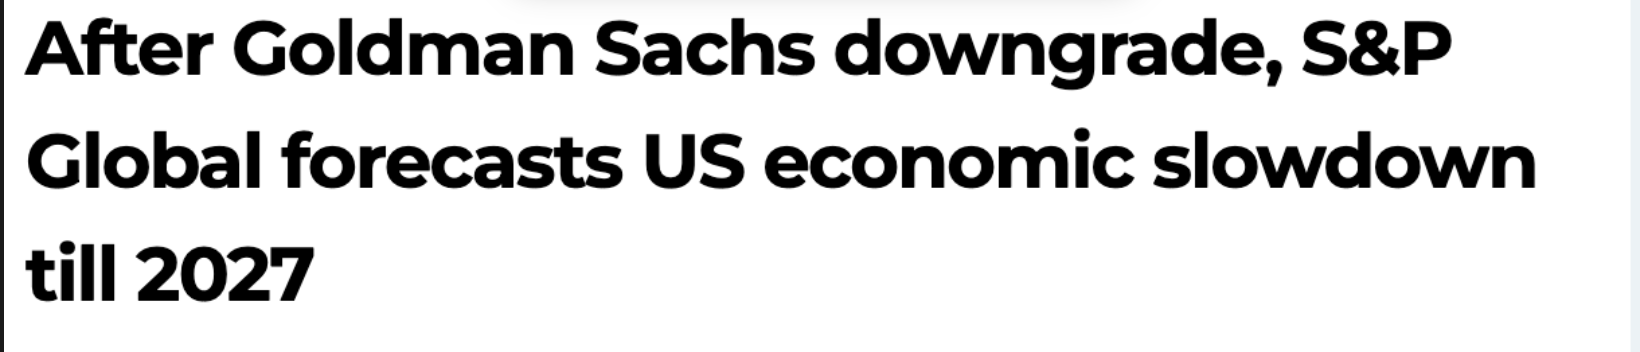
Source: CNBC, Reuters, GS
In addition, with the Democrats pretty much folding against Trump in the govt shutdown talks, that has fully opened the way for DOGE to continue with its aggressive cost-cutting crusade until at least September.
Elon’s DOGE Will Have Full Cover to Continue With Large Spending Cuts Into the Fiscal Year-End
Source: Substack News, Fox
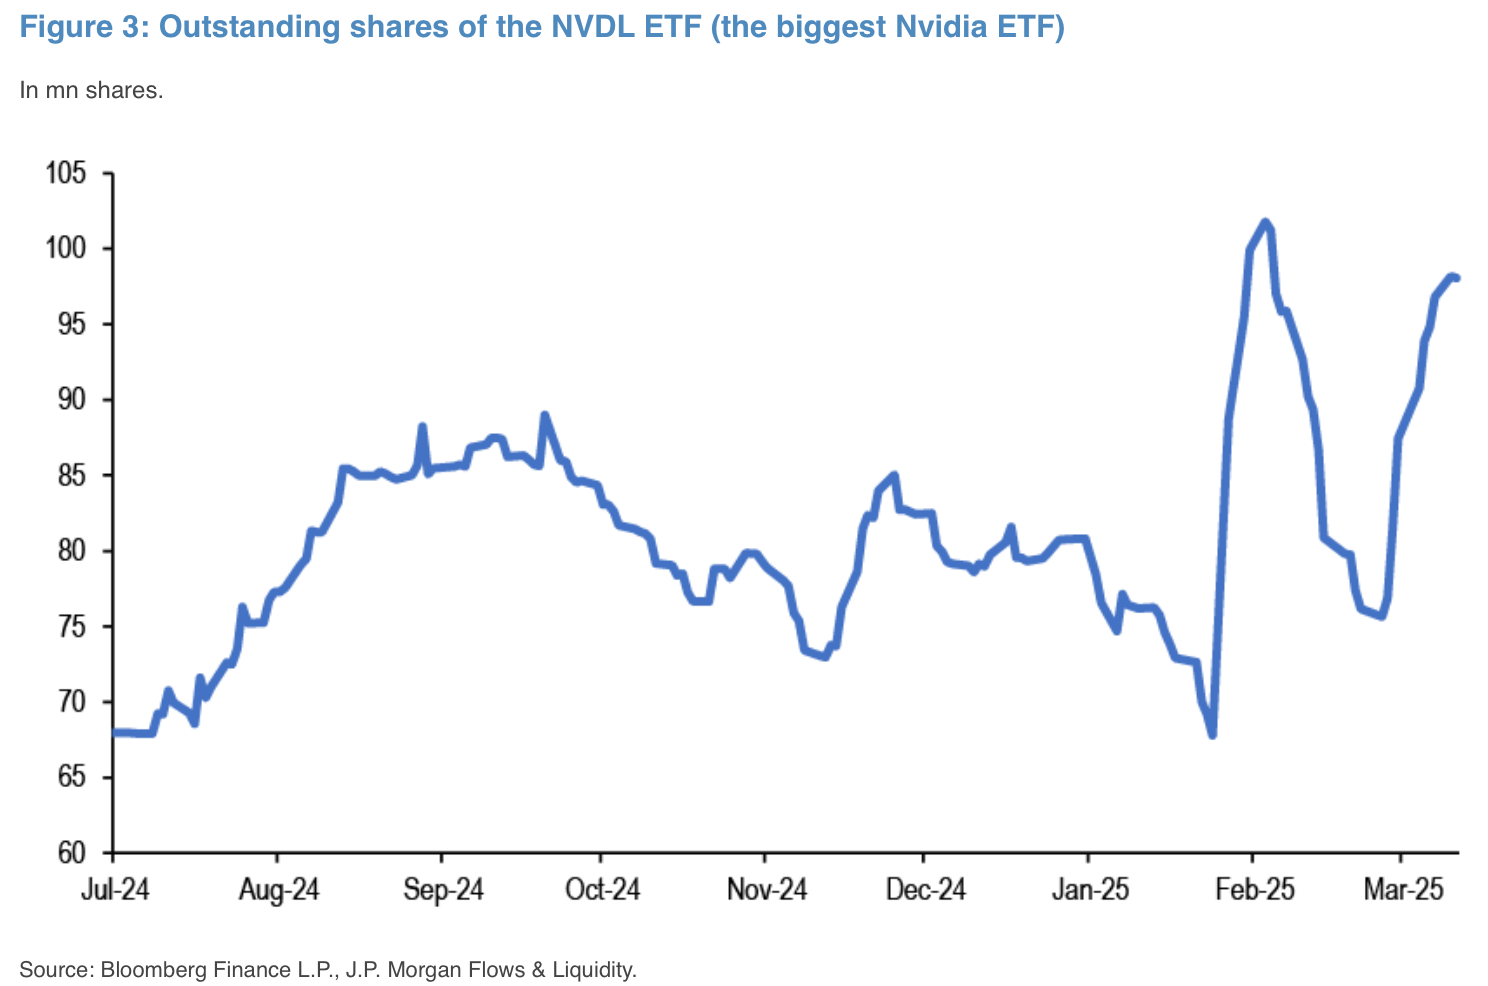
So has retail been astute enough to front-run this growth slowdown? The signs don’t appear to support that thus far. Inflows into US equity ETFs have been positive almost every single day since the February peak, while outstanding holdings in growth ETFs (such as Nvidia) have rebounded back near historical highs.
US Retail has Been Steadily Buying (and HODLing) Equity ETFs Through This Correction
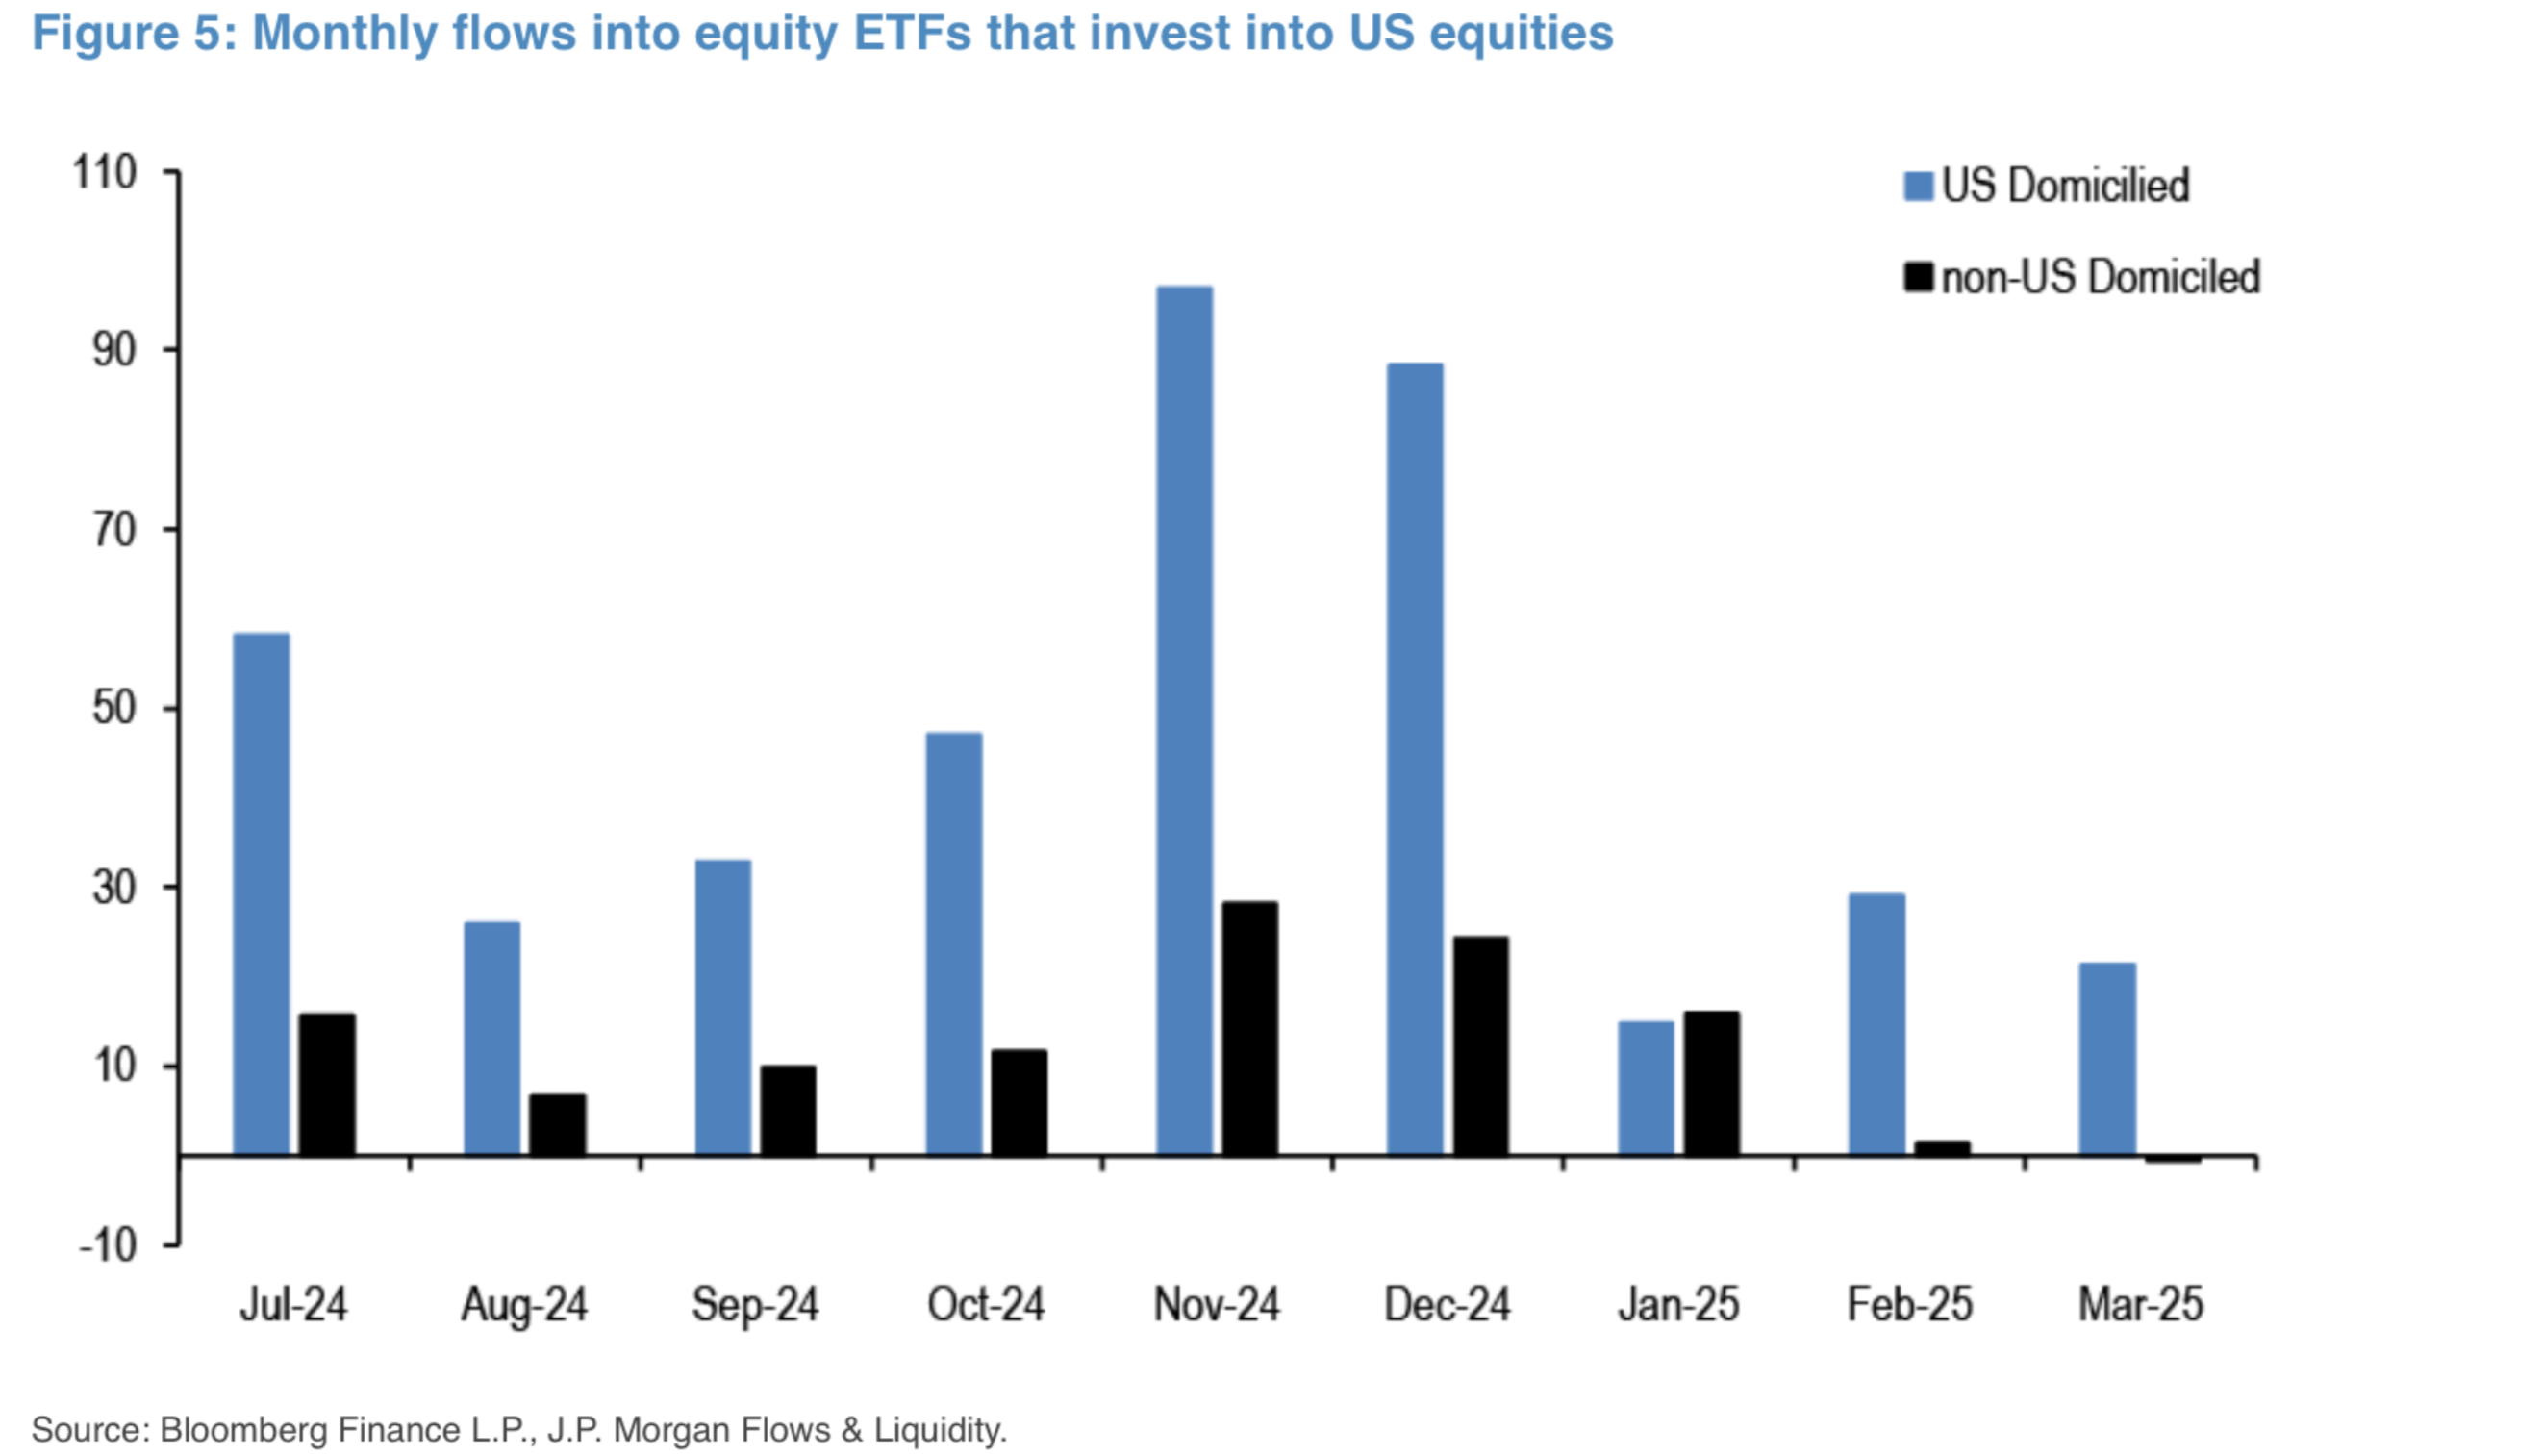
Source: JPM
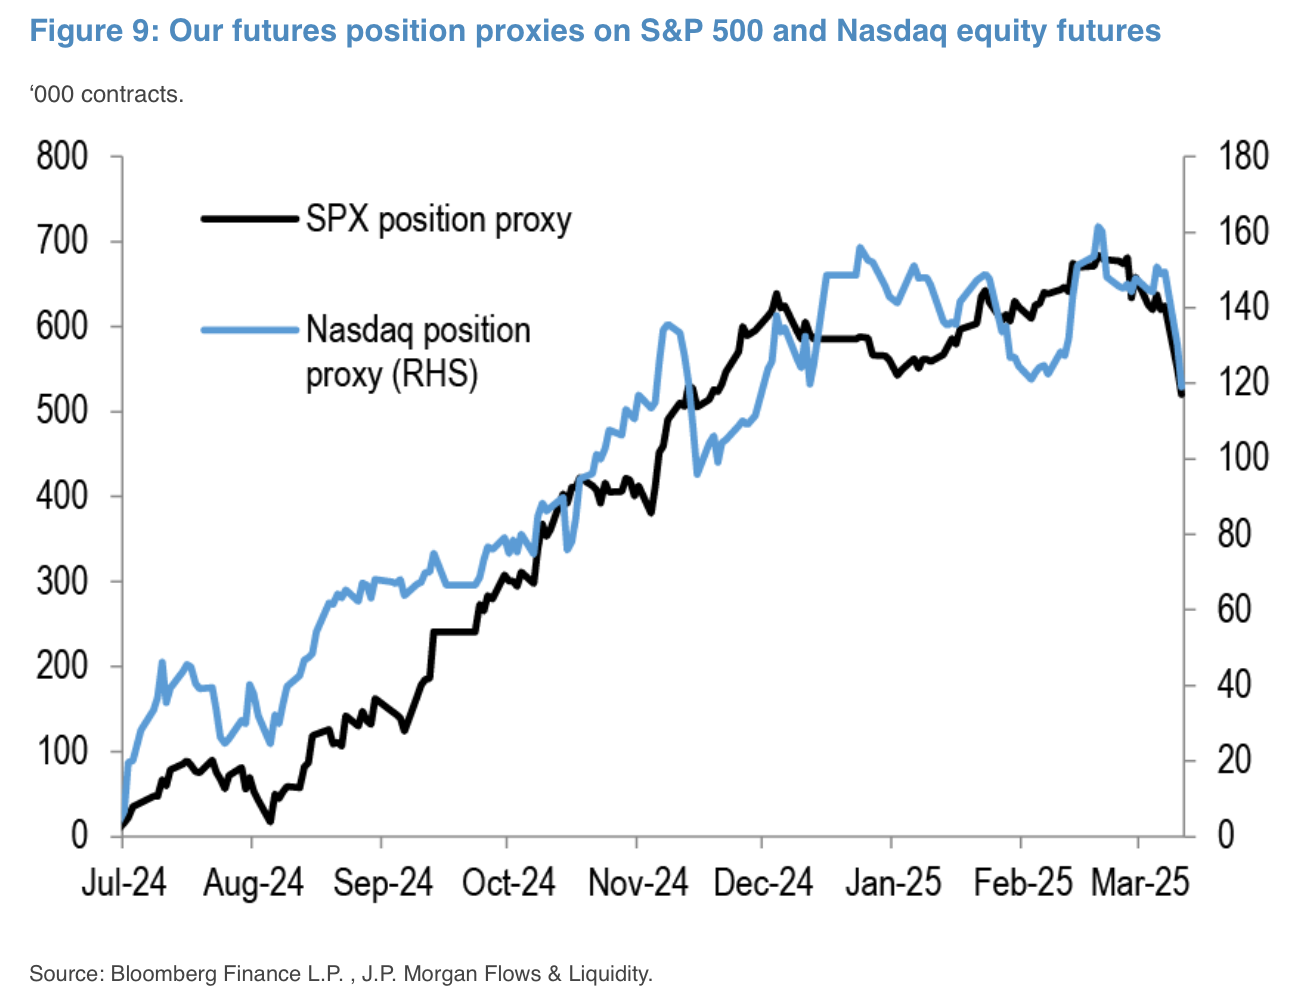
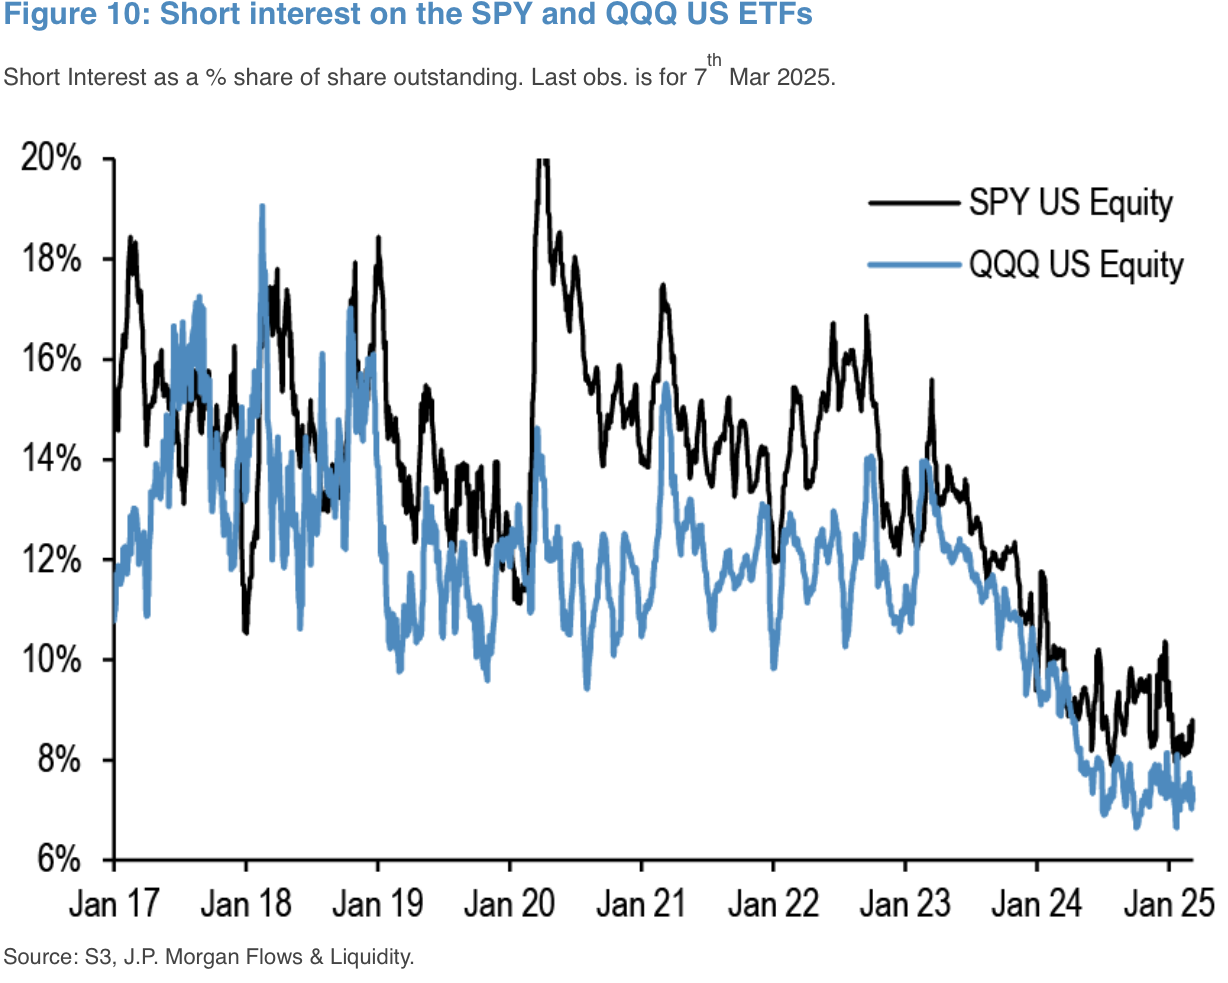
Meanwhile, long-future positions have corrected from their peaks, but remain highly elevated versus recent history. Similarly, short interest on the SPX and Nasdaq remain non-existent at near historical lows with equity bears still largely extinct.
Futures Positioning Remains Healthy With Index Shorts Still Non-Existent
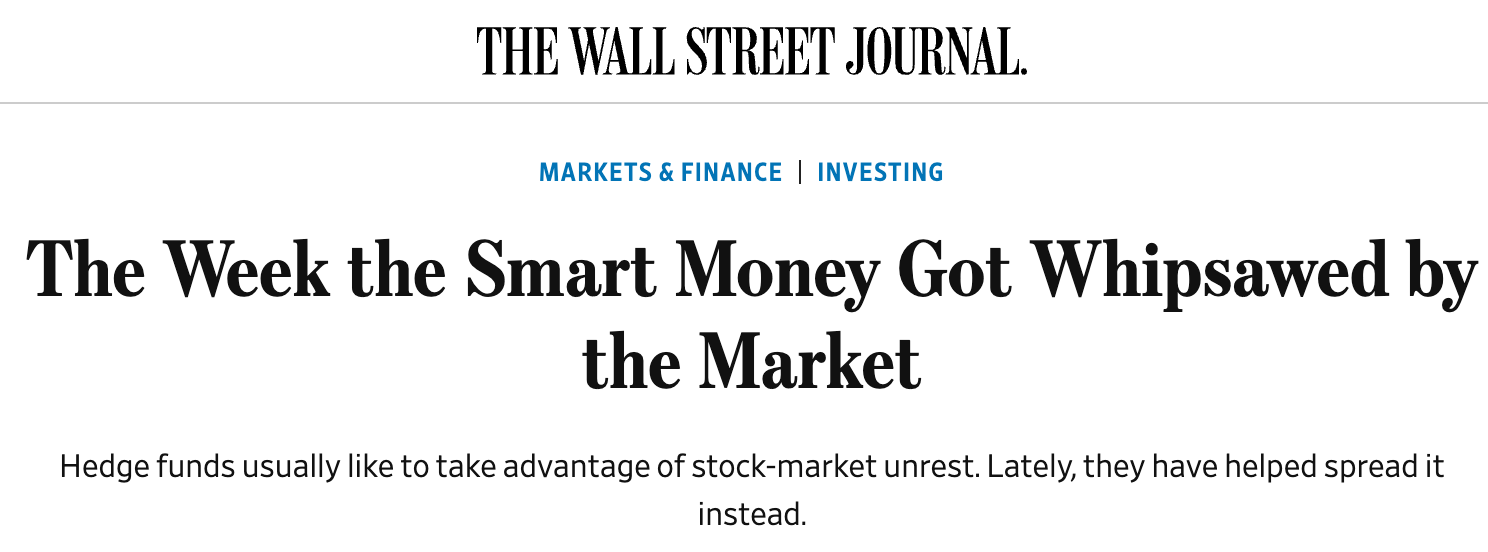
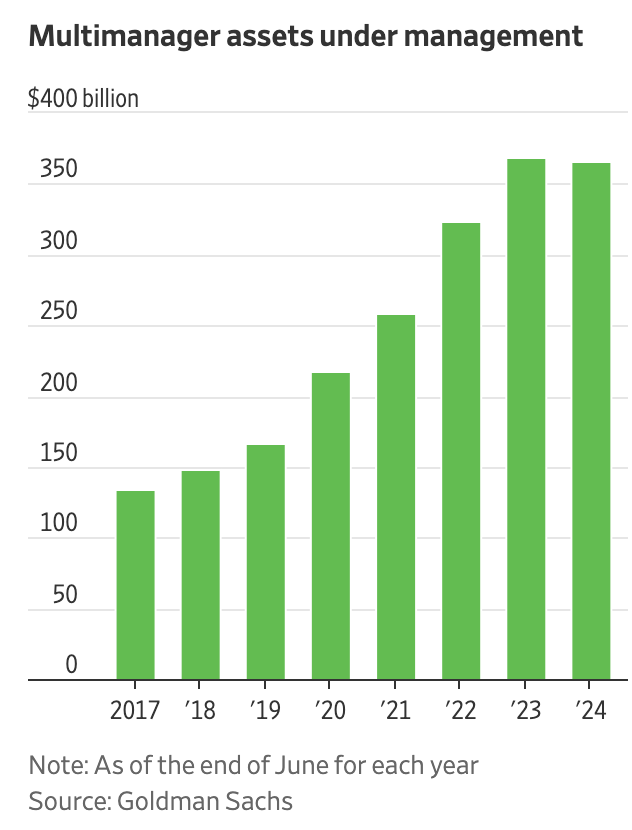
As such, the current belief is that the current sell-off is entirely driven by the massive ‘multi-strat’ hedge fund strategies that have dominated the macro space. WSJ reports that the largest of the ‘smart money’ funds (Millenium, Point 72, Citadel, etc) have seen multi-sigma drawdowns and stop-losses in their February and March performances, an extremely rare mis-hap across their long trading histories.
The chaos continued Tuesday. As stocks tumbled in the morning, Goldman Sachs sent a note to clients saying stock-picking hedge funds had just endured their worst 14-day period since May 2022.
Millennium sank 1.3% in February and was down about 1.4% through the first six days of March. Two trading teams at the firm focused on index rebalancing lost about $900 million this year. — WSJ
‘Hedge’ Funds Showing That There’s Very Little Hedging Done at the Market Extremes Once Again
Source: WSJ
This view is supported by monthly provisional hedge fund data (source: JPM), showing a big drop in equity exposures across equity-quant hedge funds. Popular long-short pairs across growth & momentum trades have been crushed, with the HF ‘VIP basket’ underperforming the SPX by ~10% over the past month alone.
Systematic & Quant Strategy Exposure to Equities Dropped Substantially in February & March
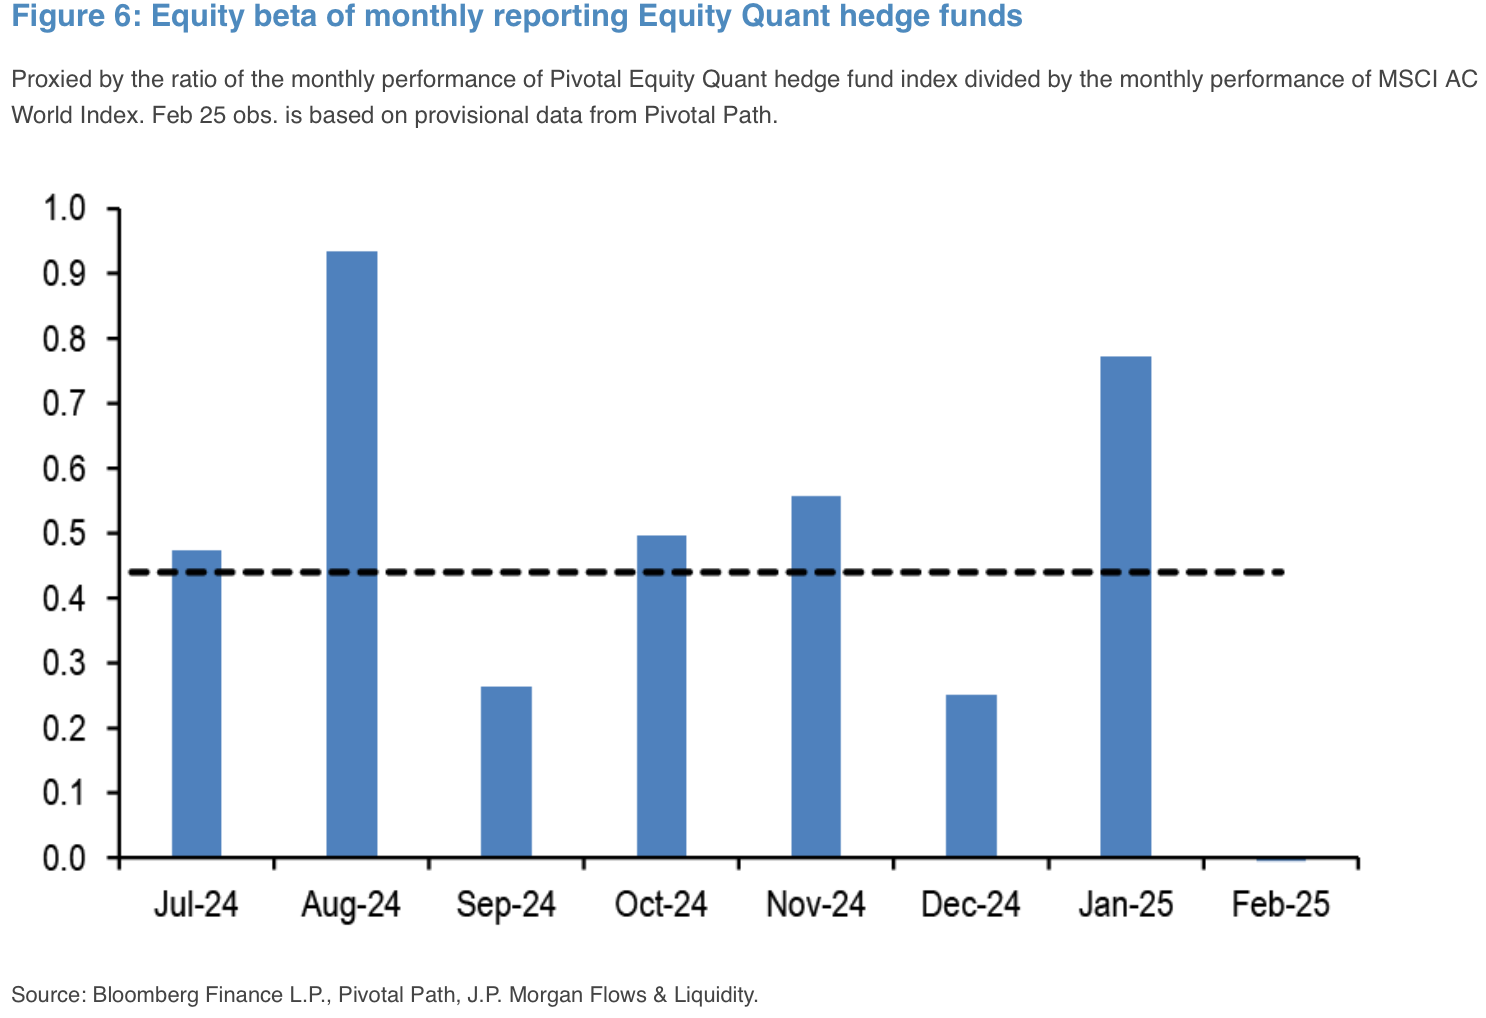
While Popular Long/Short Pairs and ‘HF VIP Baskets’ have Underperformed the Main Index by ~10% Over the Past Month
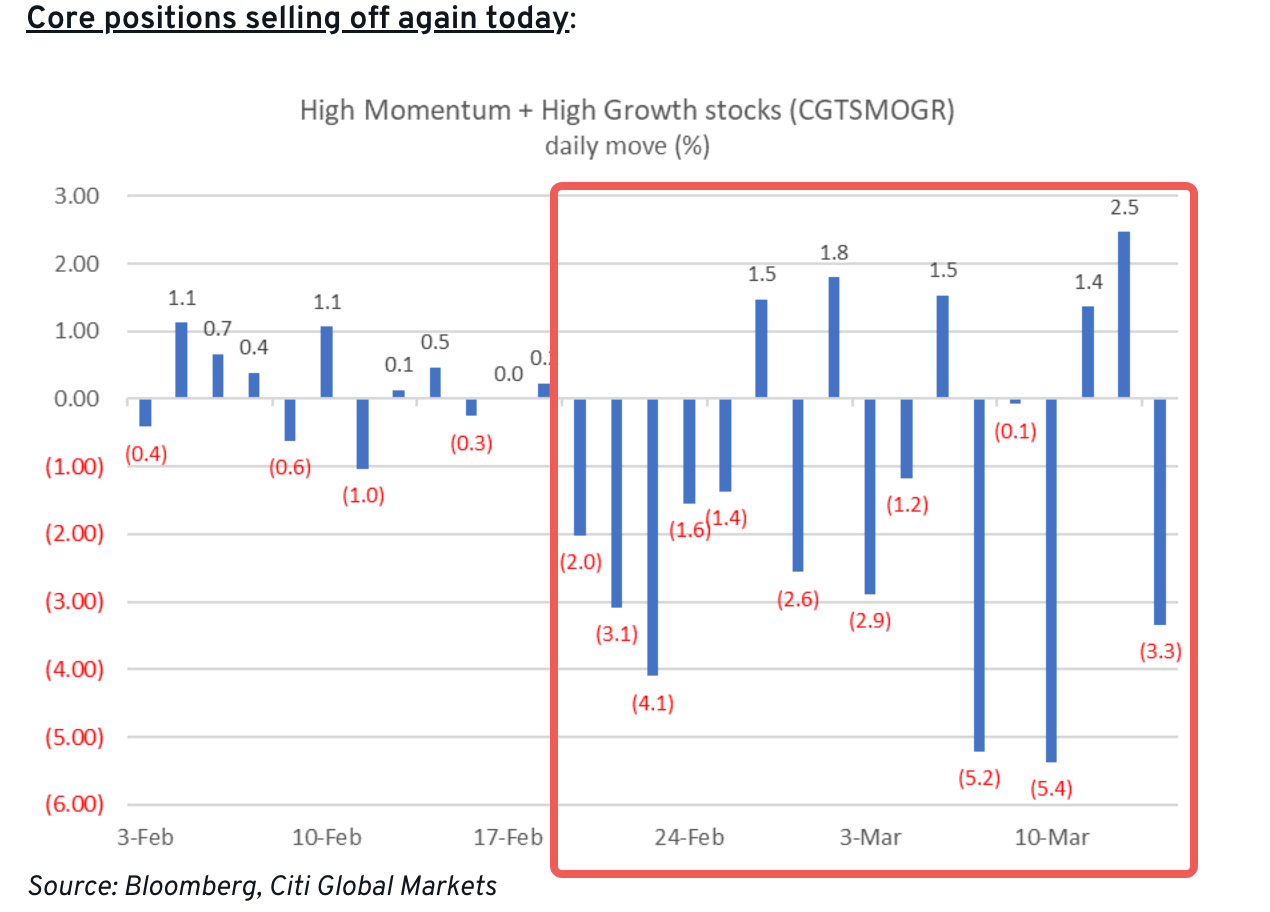
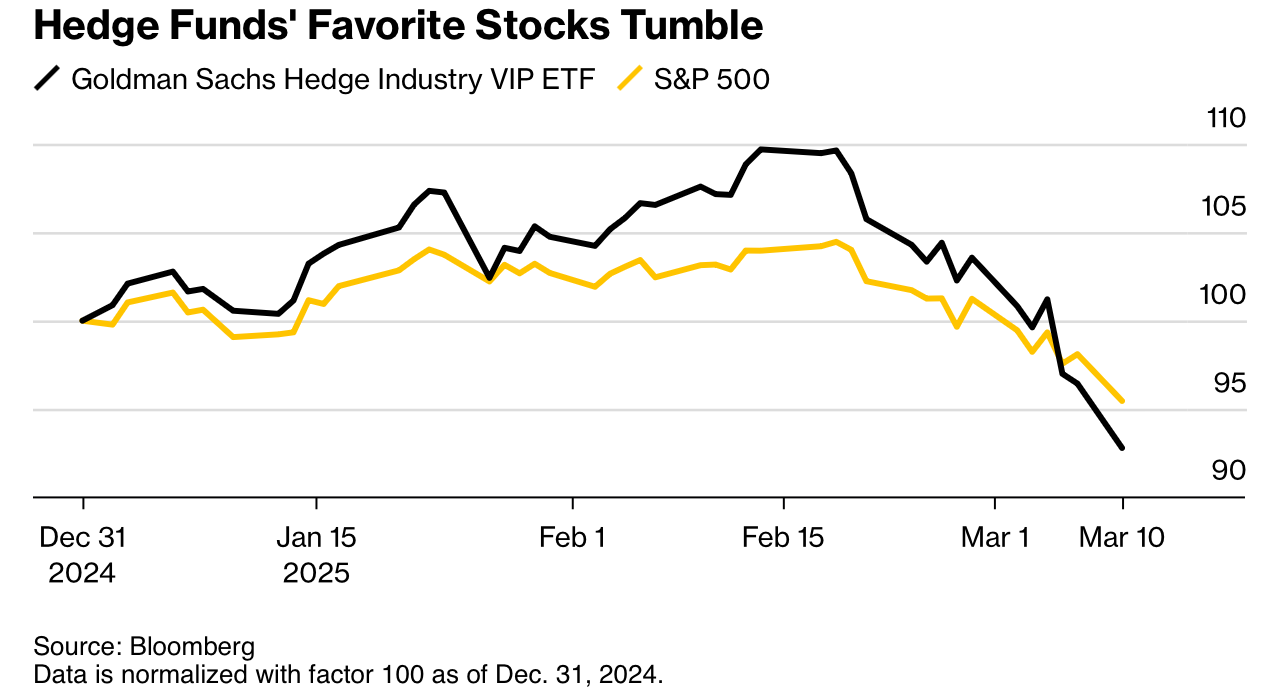
Source: Citi, Bloomberg
Unfortunately, the market pain is seen not just in public markets, but also across investment banking with M&A activities reportedly coming in at the worst pace in over 20 years on tariff uncertainties.
M&A activity in the U.S. during the first two months of this year was the slowest in more than two decades, with only 1,172 deals worth $226.8 billion through Friday, according to data compiled by Dealogic. That was down by about a third from the same time last year by both volume and size and the slowest open by volume since 2003. — Reuters
Despite Deregulation Hopes, M&A Activity has Slowed to a Crawl as Market Sentiment Turned on a Dime
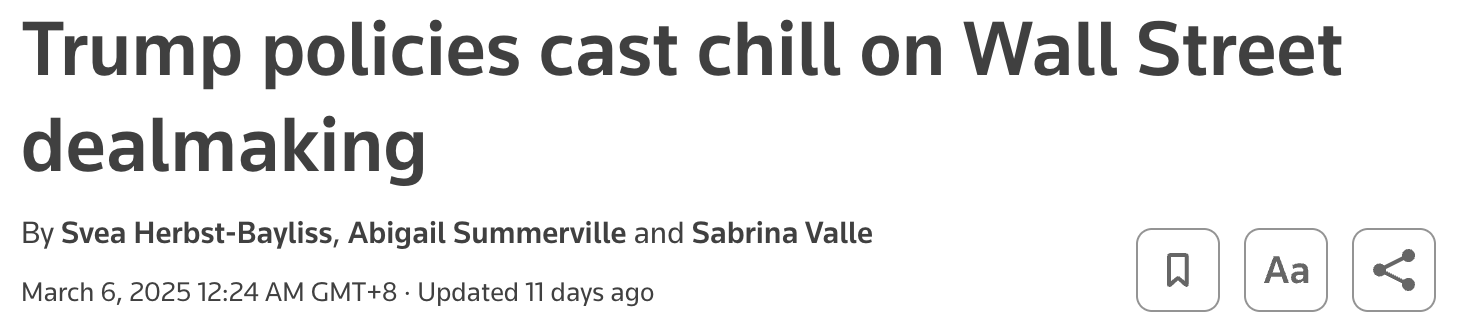
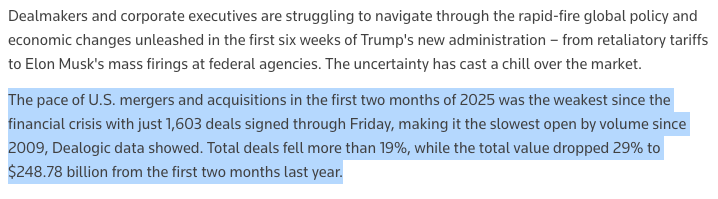
Source: Reuters
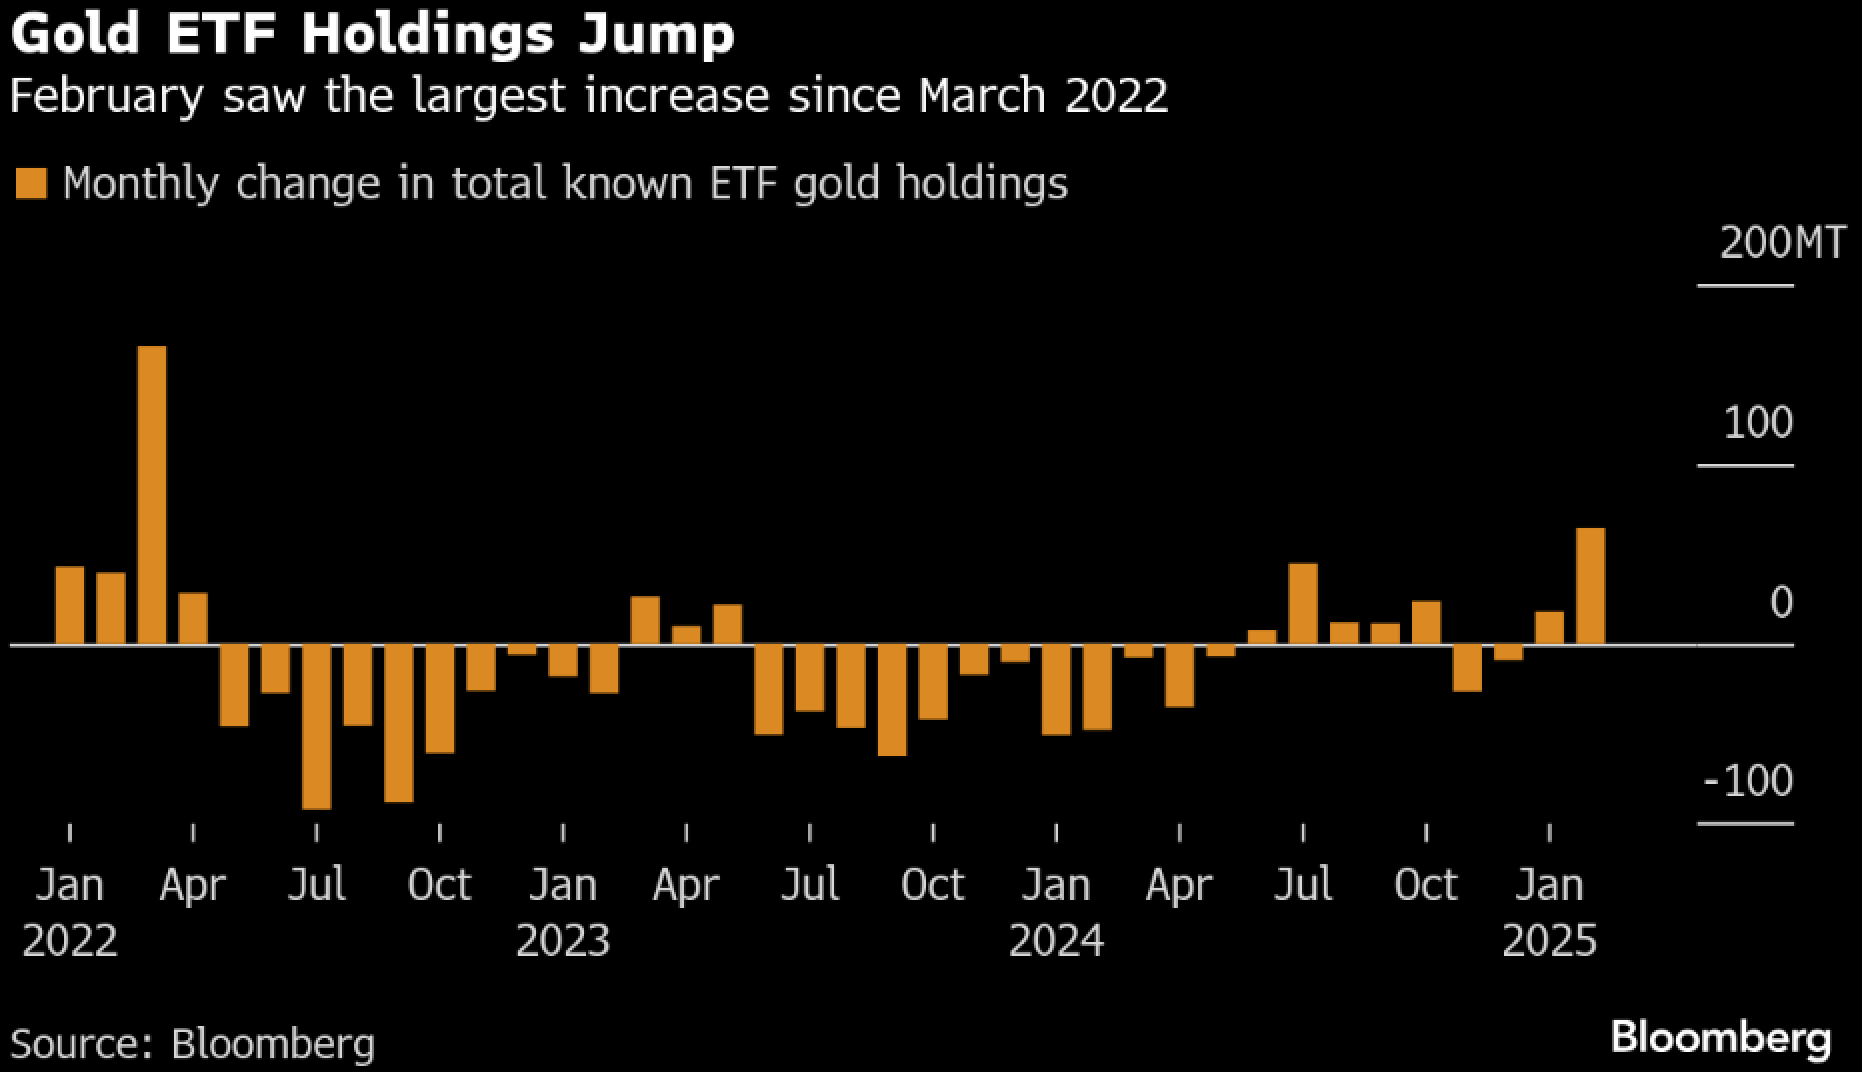
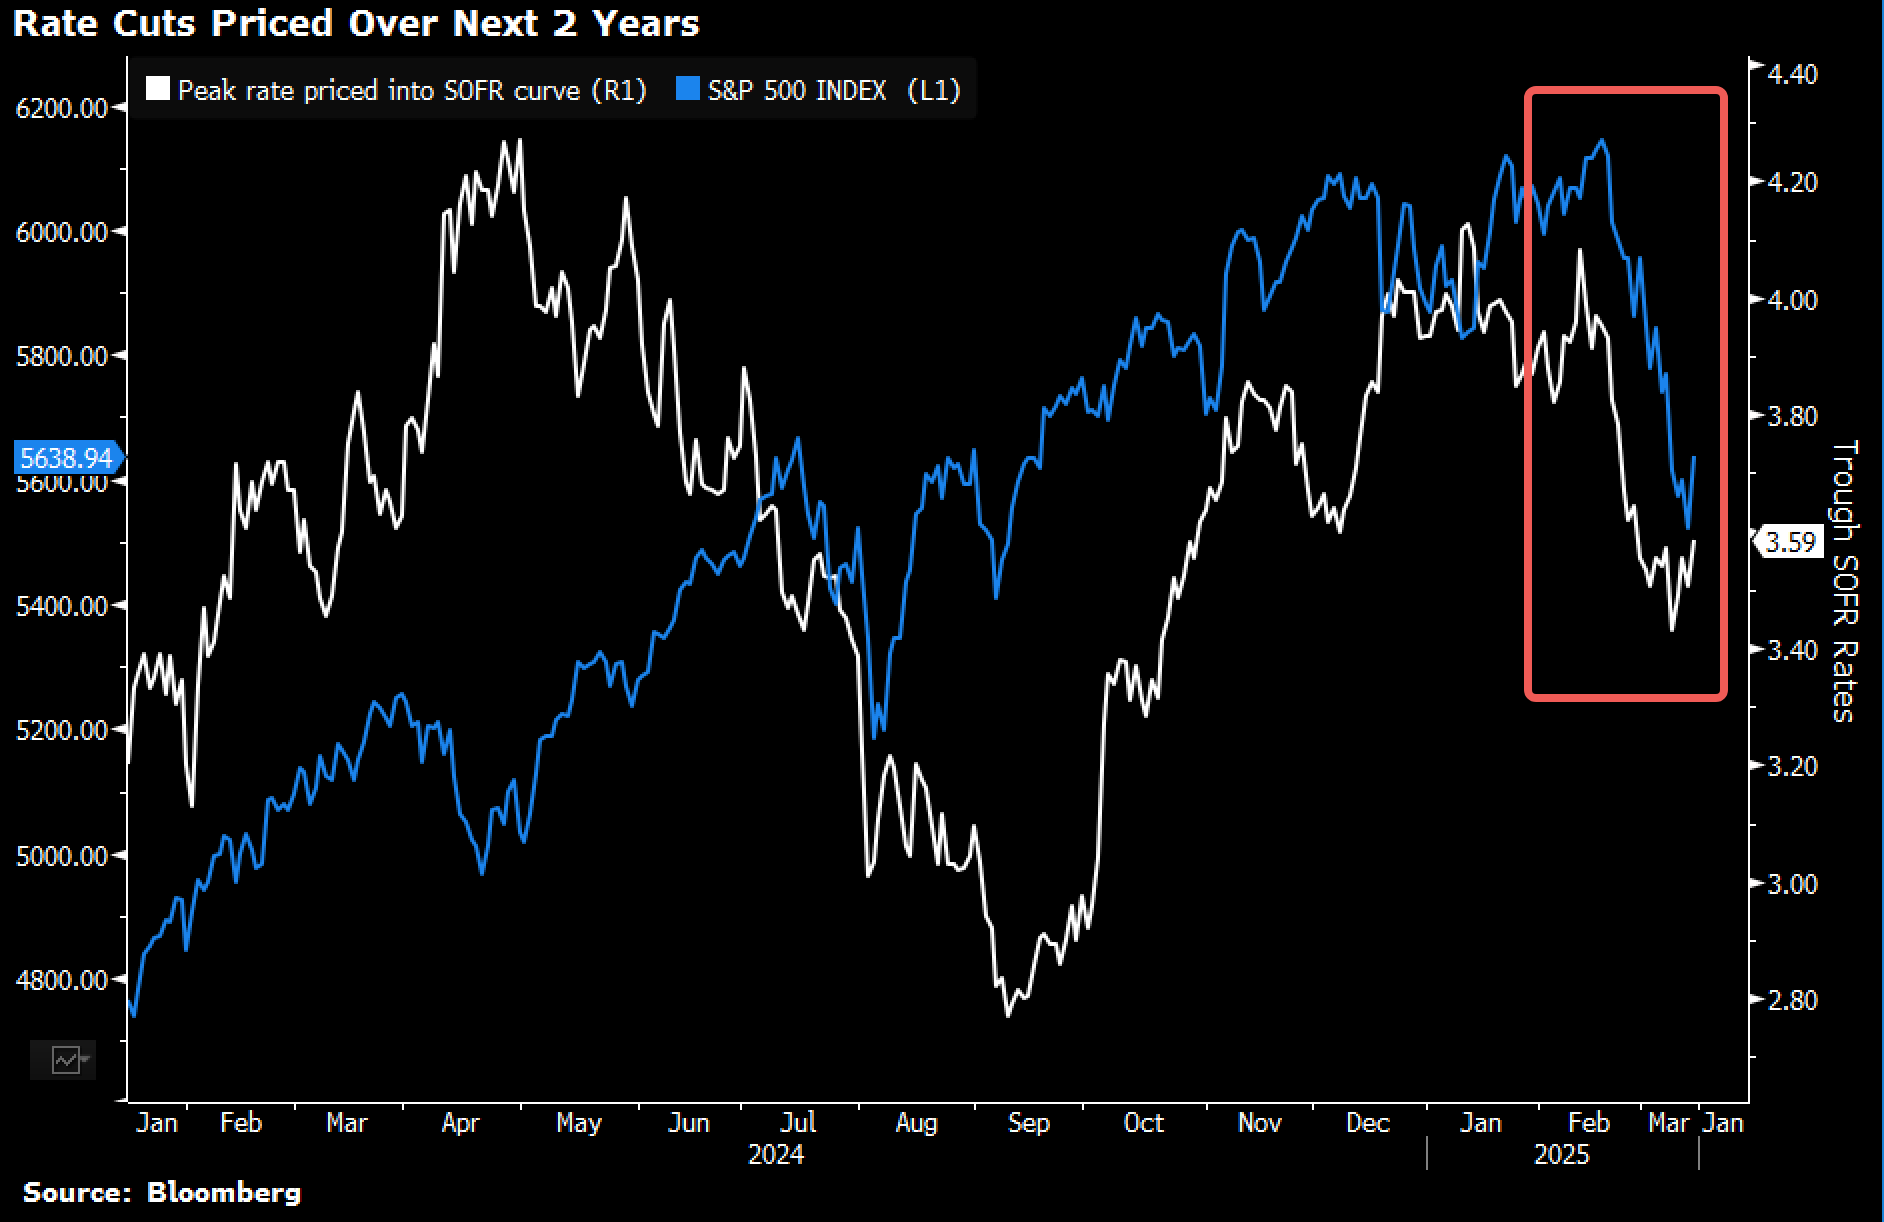
On the flip-side, outside of gold, (short dated) fixed income has been the other major beneficiary of the growth scare, with futures pricing in >2 cuts before year-end once again, and overnight rates to be as low as ~3.5% by the end of next year.
Continued Gold ETF Buying Over Geopolitical & Tariff Concerns Rallied Spot Gold Above $3k for the 1st Time
Rate Markets Calling in >2 Rate Cuts Before Year-End for Fed Policy Rates to Trough at 3.5% by 2026
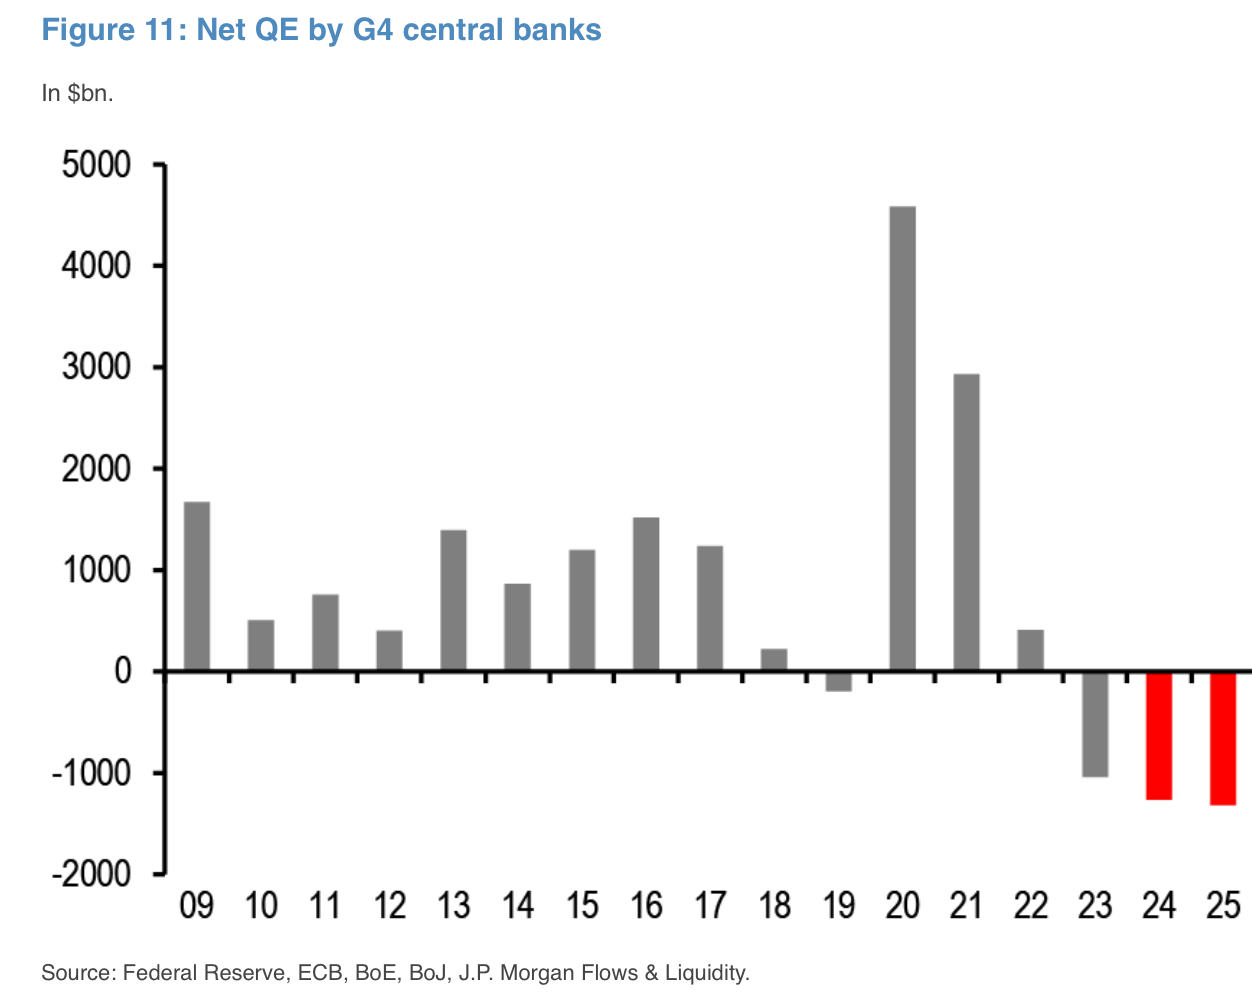
Undoubtedly, the continued withdrawal of excess liquidity from global ‘QT’, and a persistent short-base in US Treasuries (concerns over rising deficit etc) have certainly aided in the current bond rally.
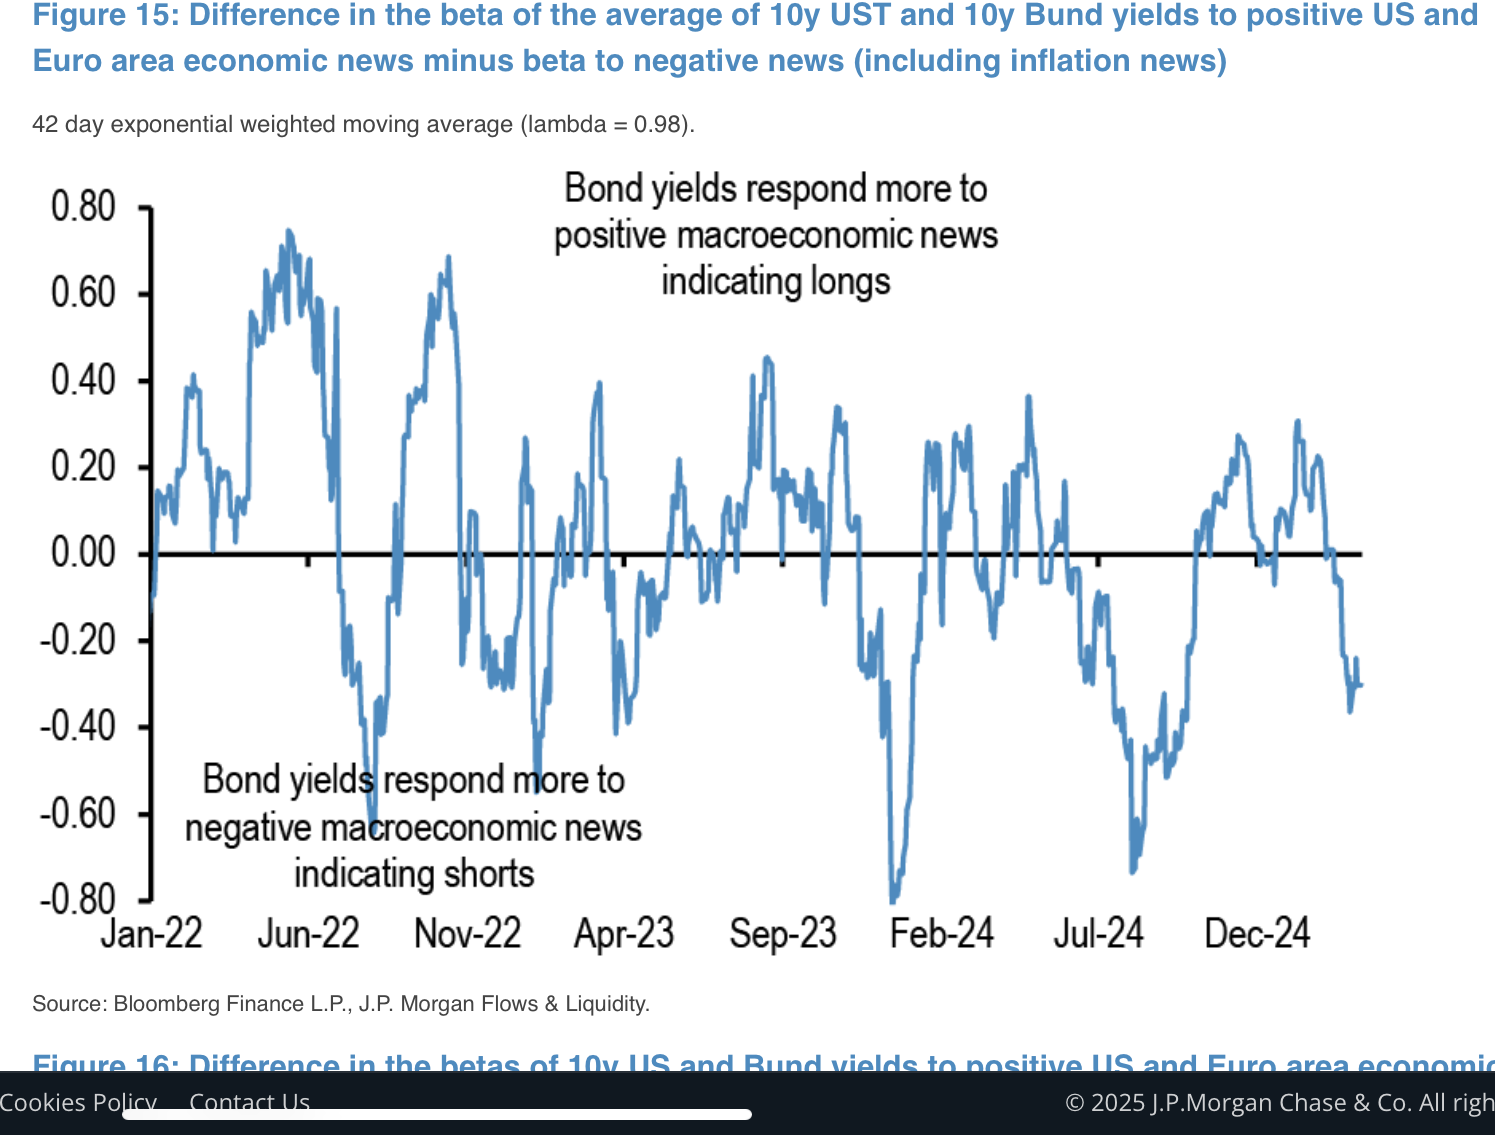
CBs are Still Proceeding with ‘QT’ (Balance Sheet Run-Offs) While Investors Remain Stubboringly Short US Treasuries Over Deficit Concerns
Source: JPM
Finally, equity valuations outside of the major large caps are actually relatively contained vs historical averages, and economic hard data is likely to outperform the rapid deterioration in soft data, so market consensus is that this remains a ‘buy the dip’ market while we work through the tariff volatility.
SPX Forward PE Ratios ex-Large Caps are Actually Relatively Contained vs Historicals
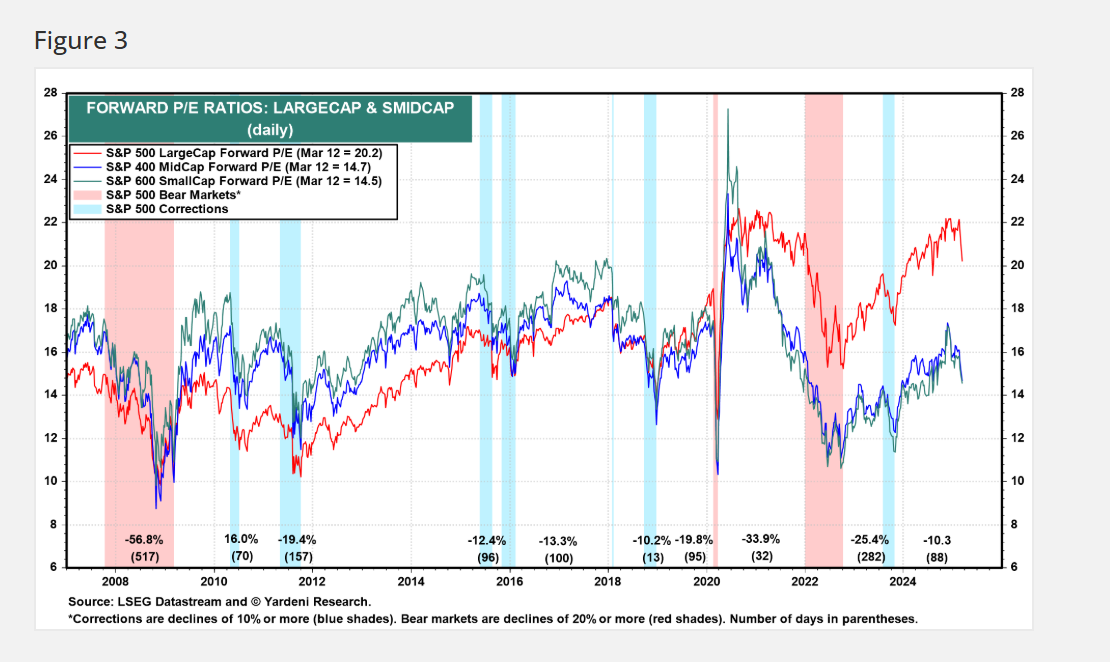
Source: Yardeni
In crypto, sentiment remains muted with BTC hovering around the low $80k area post the strategic reserve disappointment, while altcoins fared better with a jump in Solana, Chainlink, and XRP (~10% higher WoW) following the Friday rebound in risk sentiment.
BTC ETFs saw record outflows last week and traders have already been hedging via downside puts as we appear to enter a range bound market in the near-term.
Most Crypto Prices (ex ETH) Saw Decent Week-on-Week Bounces Following Record ETF Outflows the Past Week
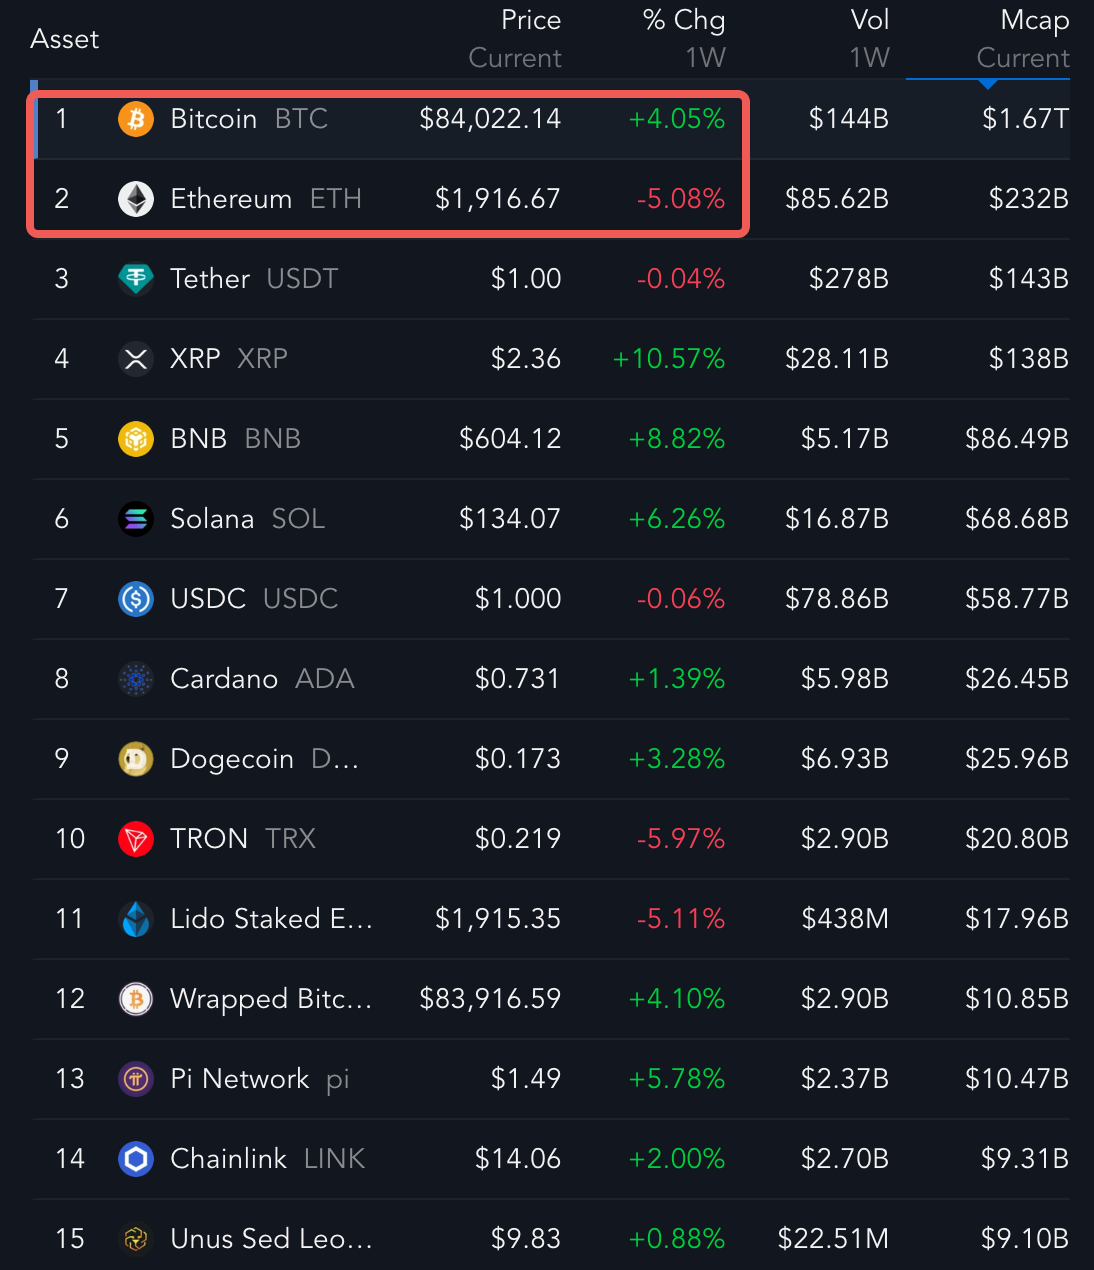
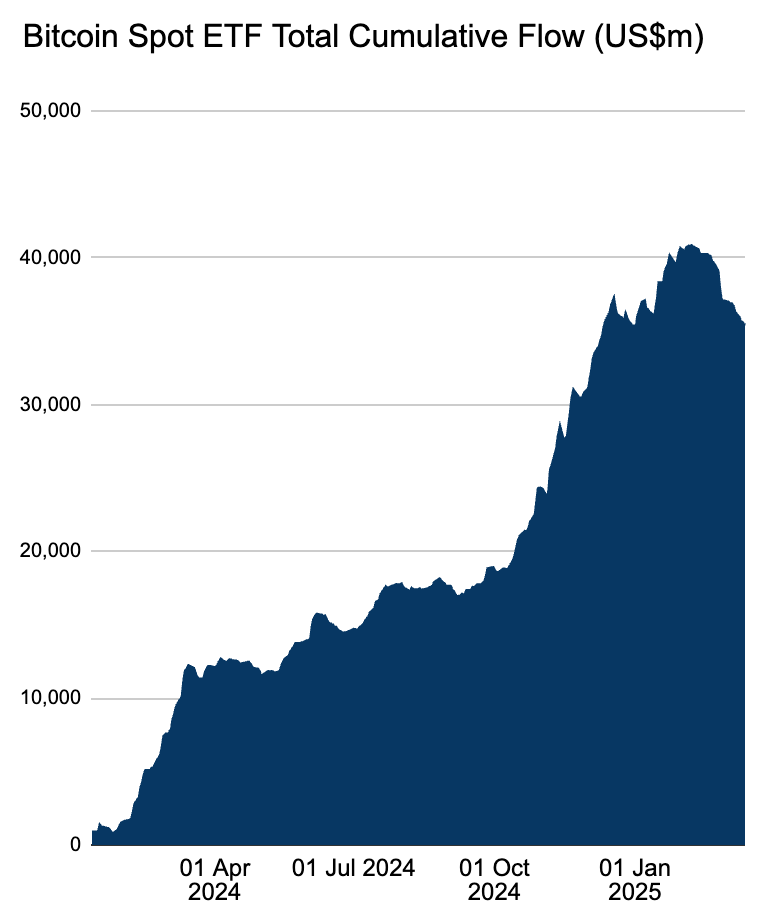
Source: Messari, Farside Investors
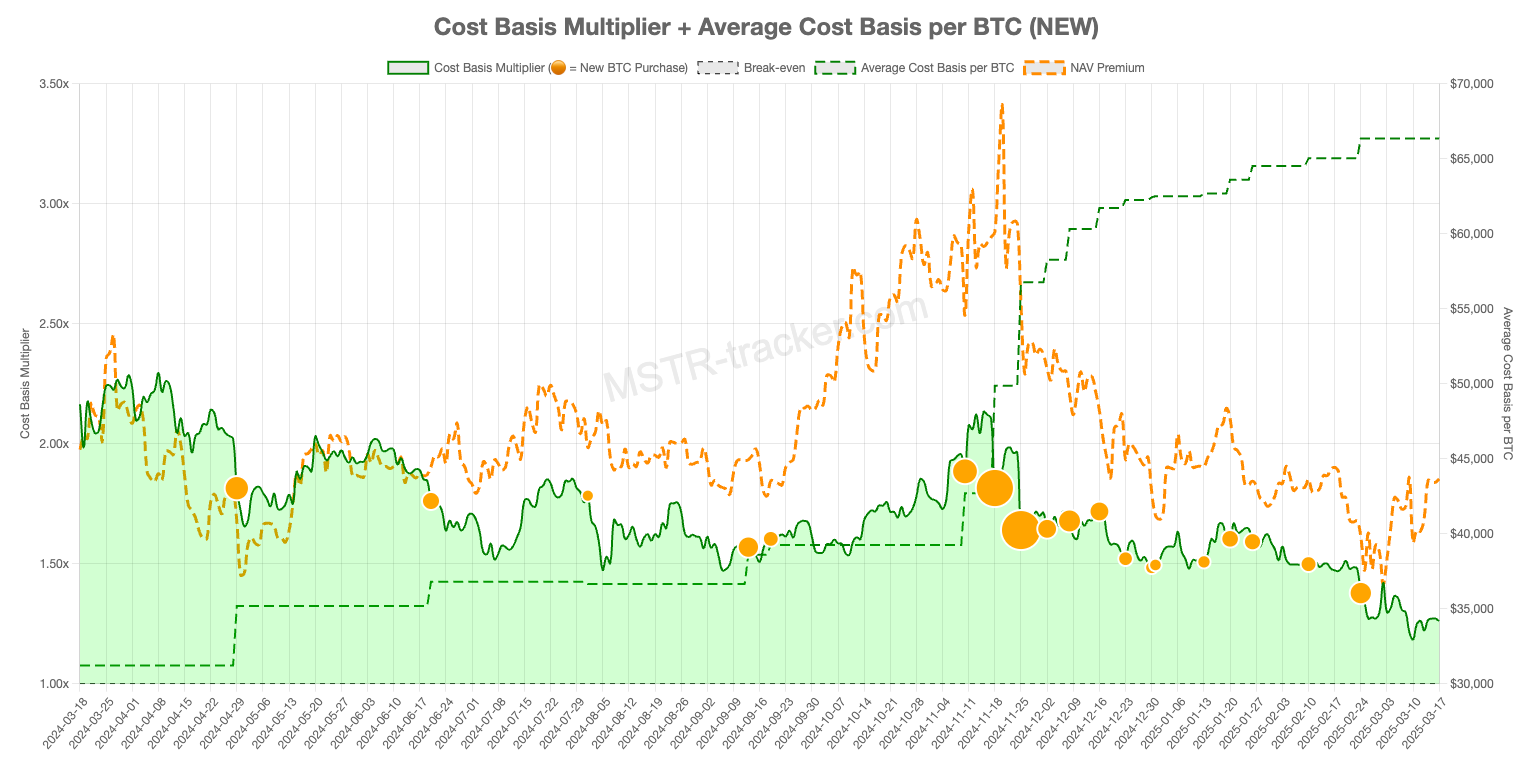
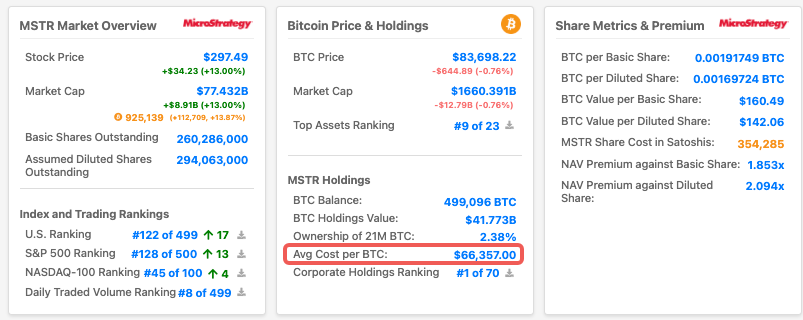
As sentiment takes a hit, publicly listed bitcoin miners have turned towards debt for their capex funding needs following a record year of equity fund raising from MSTR. As long as funding venues remain open, miners should be able to sustain operations without significant BTC divestitures to keep selling pressures in-check, though it would be important to keep an eye on this area as we head further into the year. MSTR’s NAV premium has steadied around 1.8x, while their weighted-average BTC cost basis is at ~$67k, so still around 15-20% of buffer from current spot levels.
Listed Bitcoin Miners have Been Active in Tapping Debt Markets for Capex Funding YTD, as Equity Sentiment Sours
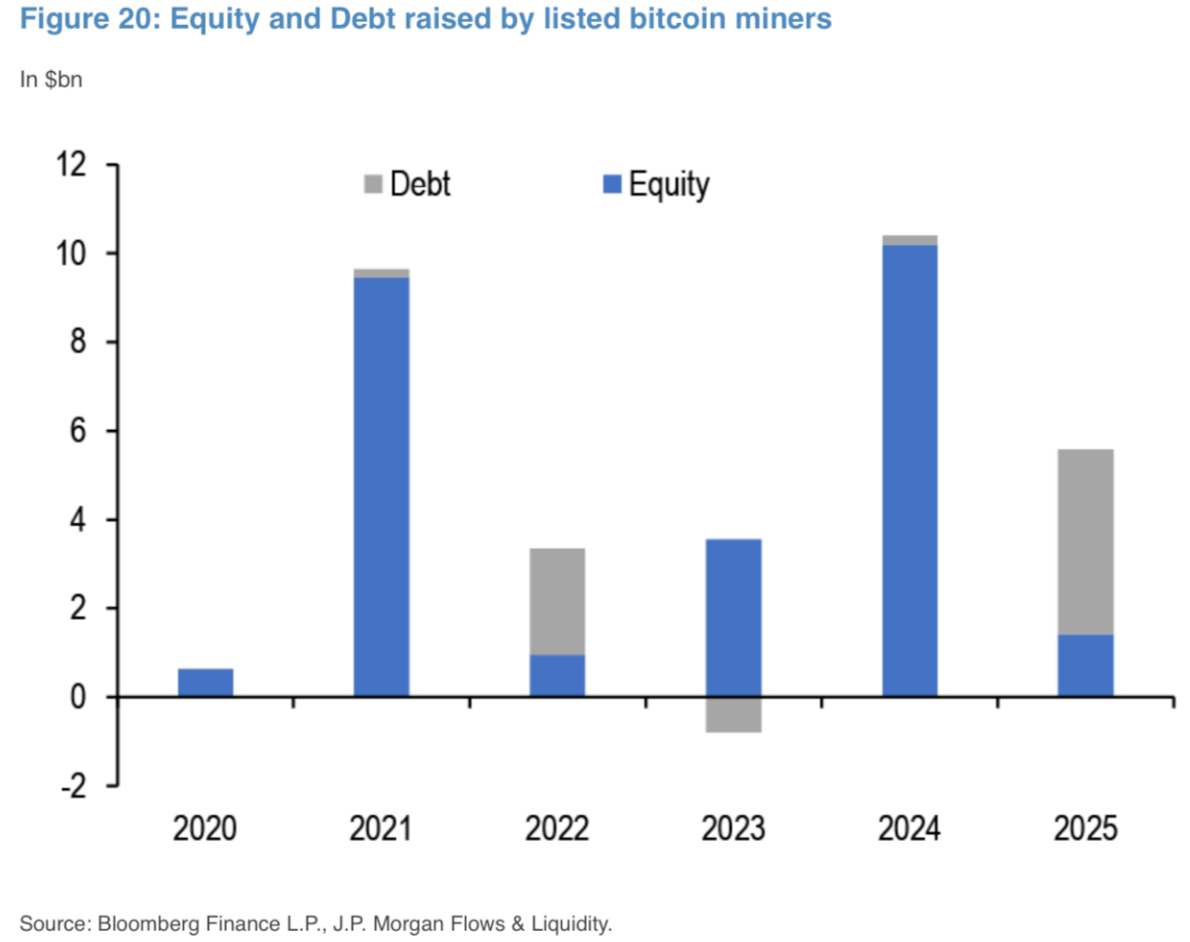
Source: JPM
MSTR’s NAV Premium has Steady Around the 1.8x Level with Their Cost Buffer Still Around ~20% Lower from Here
Source: MSTR Tracker
At the risk of sounding like a broken record, crypto’s achilles heel remains with Ethereum, which fell another 5% week-on-week and has underperformed BTC by a whopping ~10% over that timeframe. The BTC/ETH ratio is now trading at 0.023, a level not seen since 2021, when BTC spot was trading at just around $35K.
Will ETH Ever Catch a Bid Again?
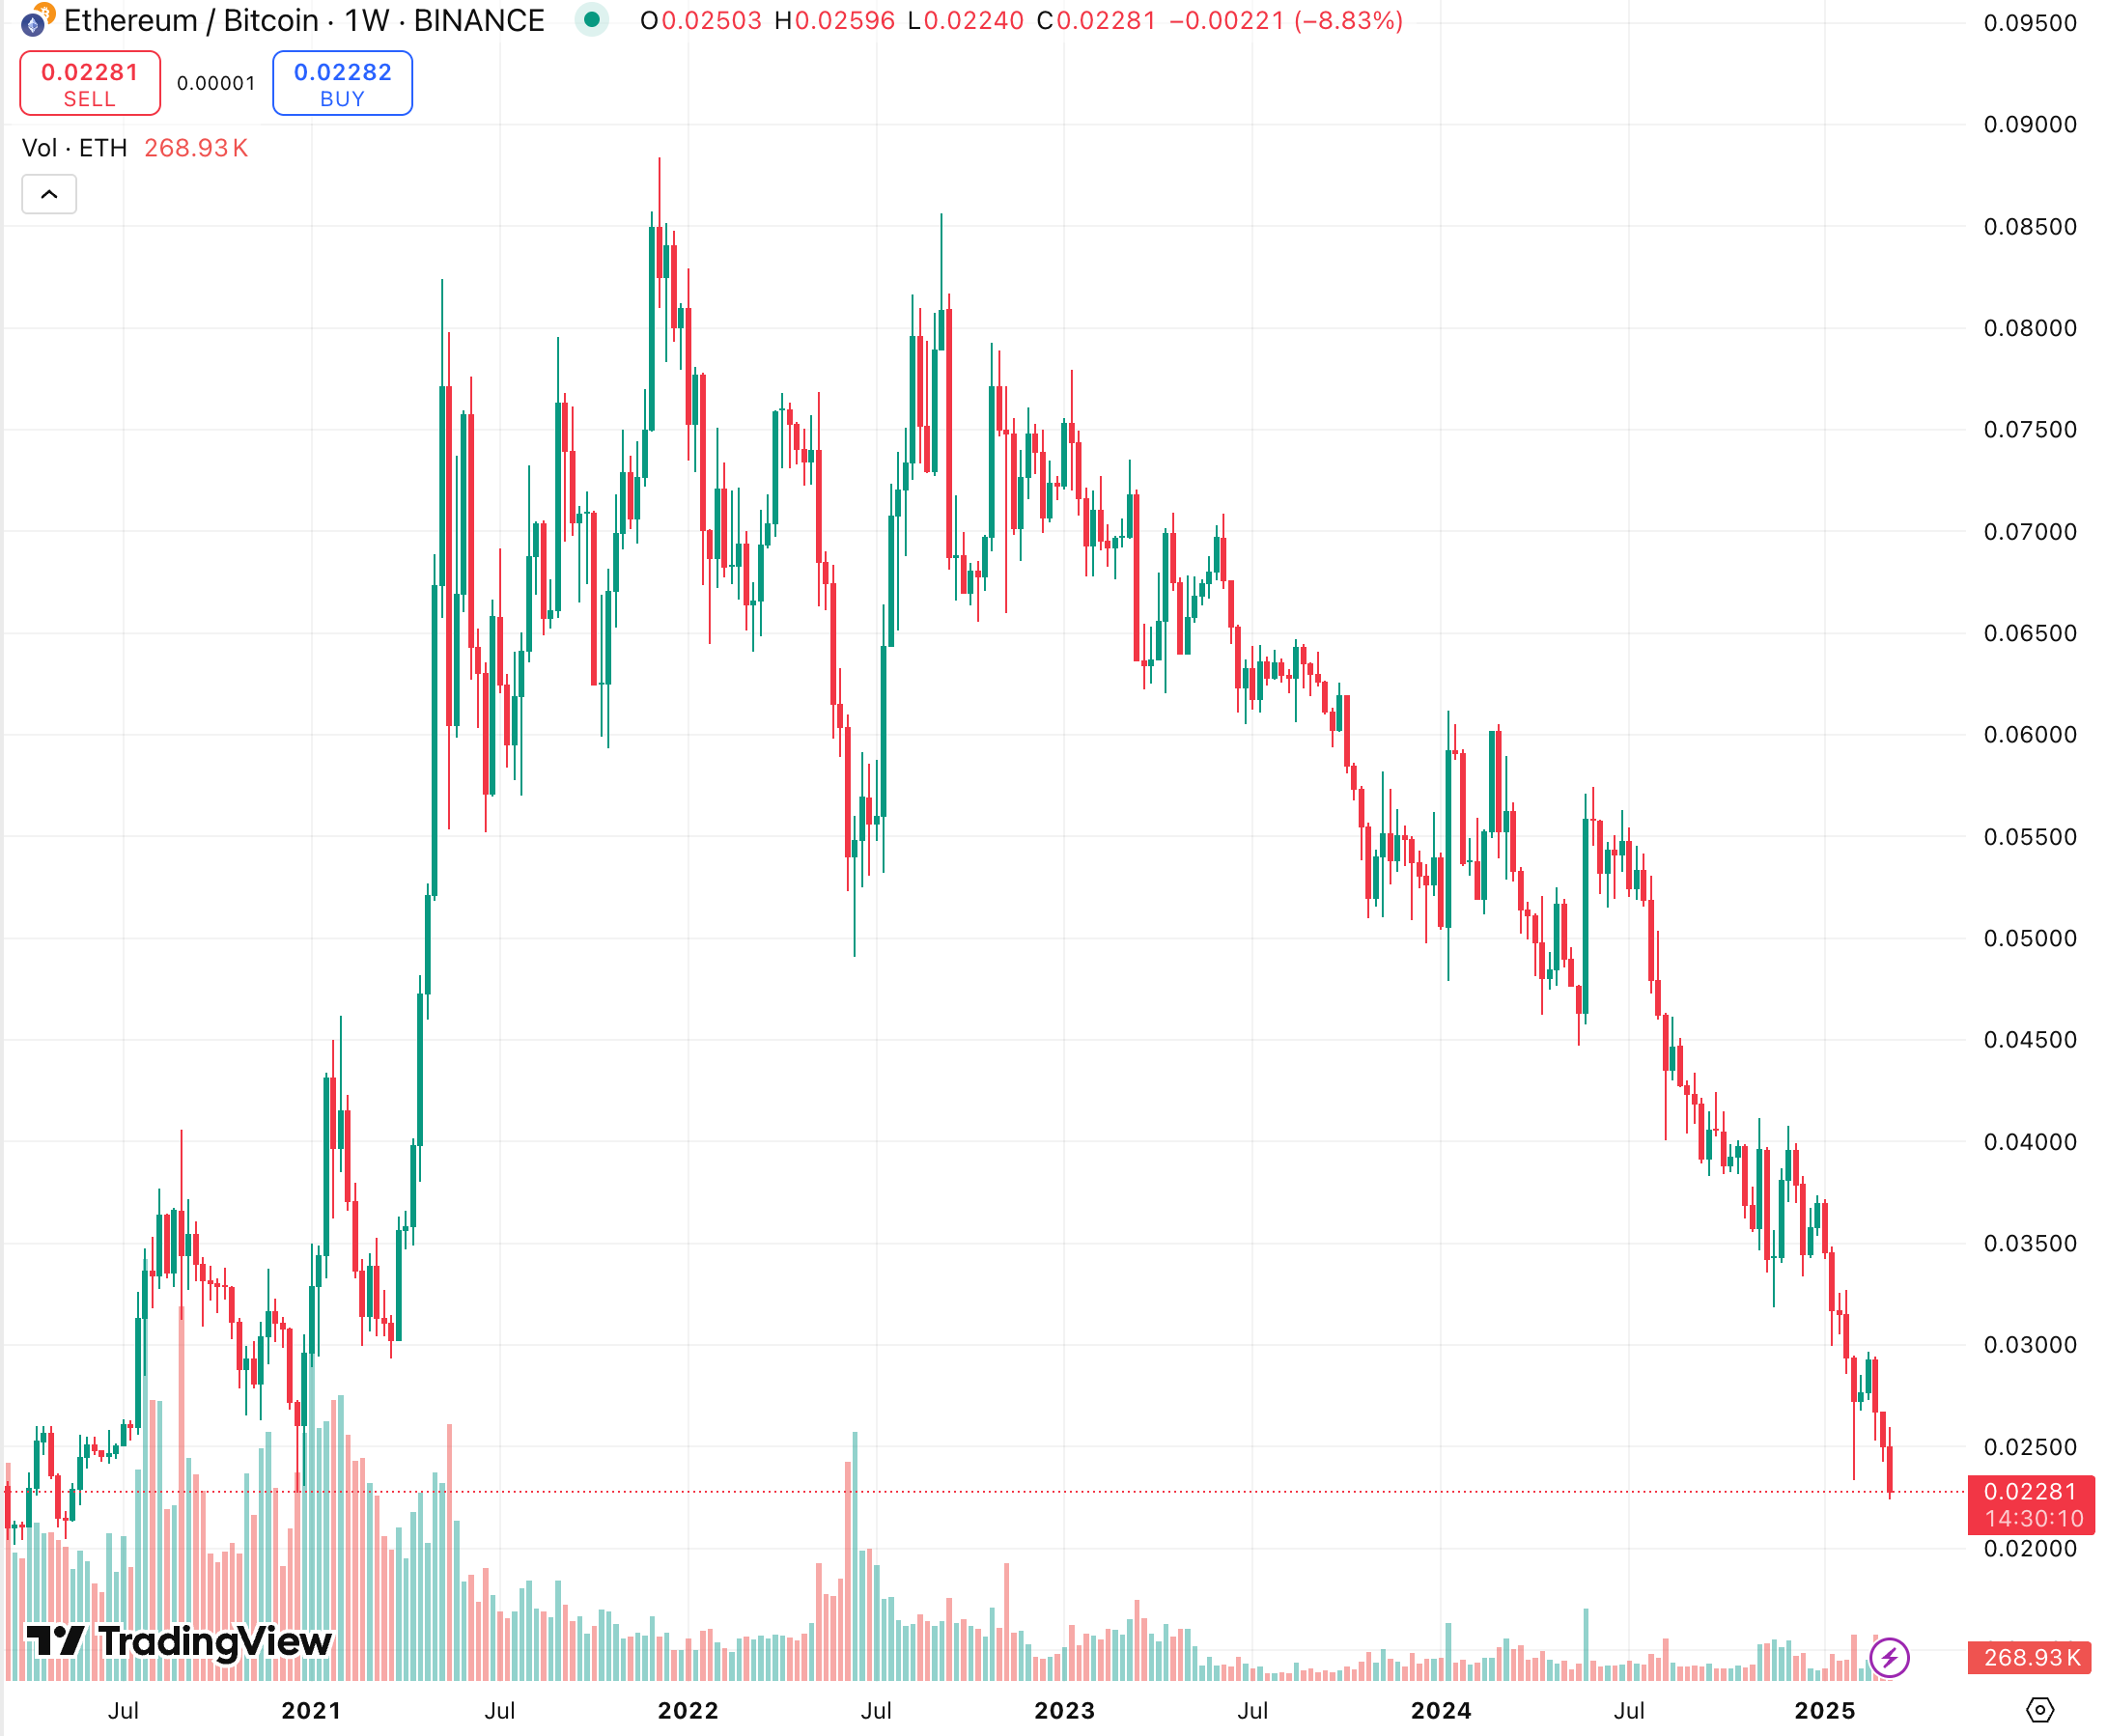
Source: TradingView
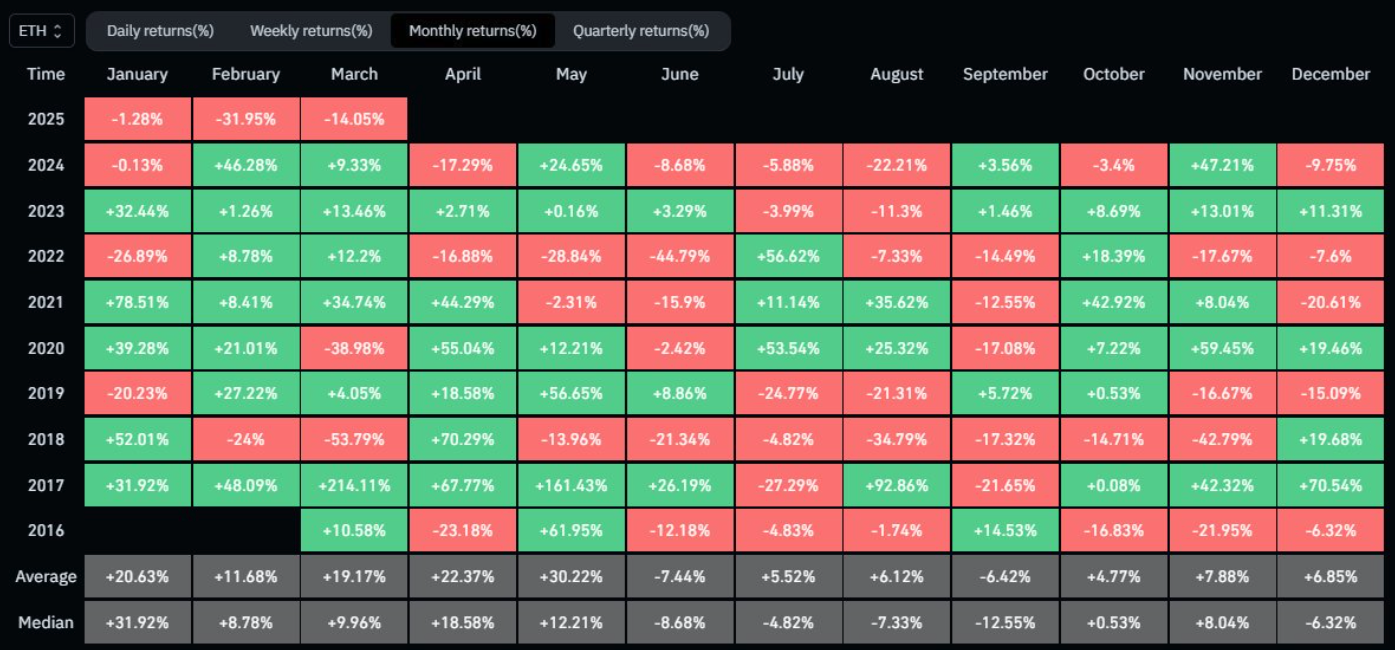
A lethal combination of general apathy, PNL stop-losses, a lack of new narrative and unresolved value distribution with L2s continue to plague the #2 token. According to CoinGecko, the total market cap of stablecoins has now surpassed that of Ethereum’s ($236B vs $226B), and ditto for the total value of all ERC20 tokens combined ($255B). In fact, this is the first time in history that ETH has started the first 3 months of the new year in the red as prices have fallen by nearly 48% YTD, with less than 50% of active wallet addresses in profit as the PNL damage is widespread.
Unfortunately, it will be difficult to expect prices to see a rapid turnaround with the kind of structural damage we are seeing in the ETH ecosystem, and it seems likely to expect any major strategic pivot from the Ethereum Foundation in the foreseeable future.
As they say, ‘the beatings will continue until morale improves’ – keep your bullets dry friends!
This is the Worst YTD Start for ETH in History
Source: @CryptoVirtuos on X
Only <50% of ETH Addresses are in Profit Now Despite the Crypto Runup
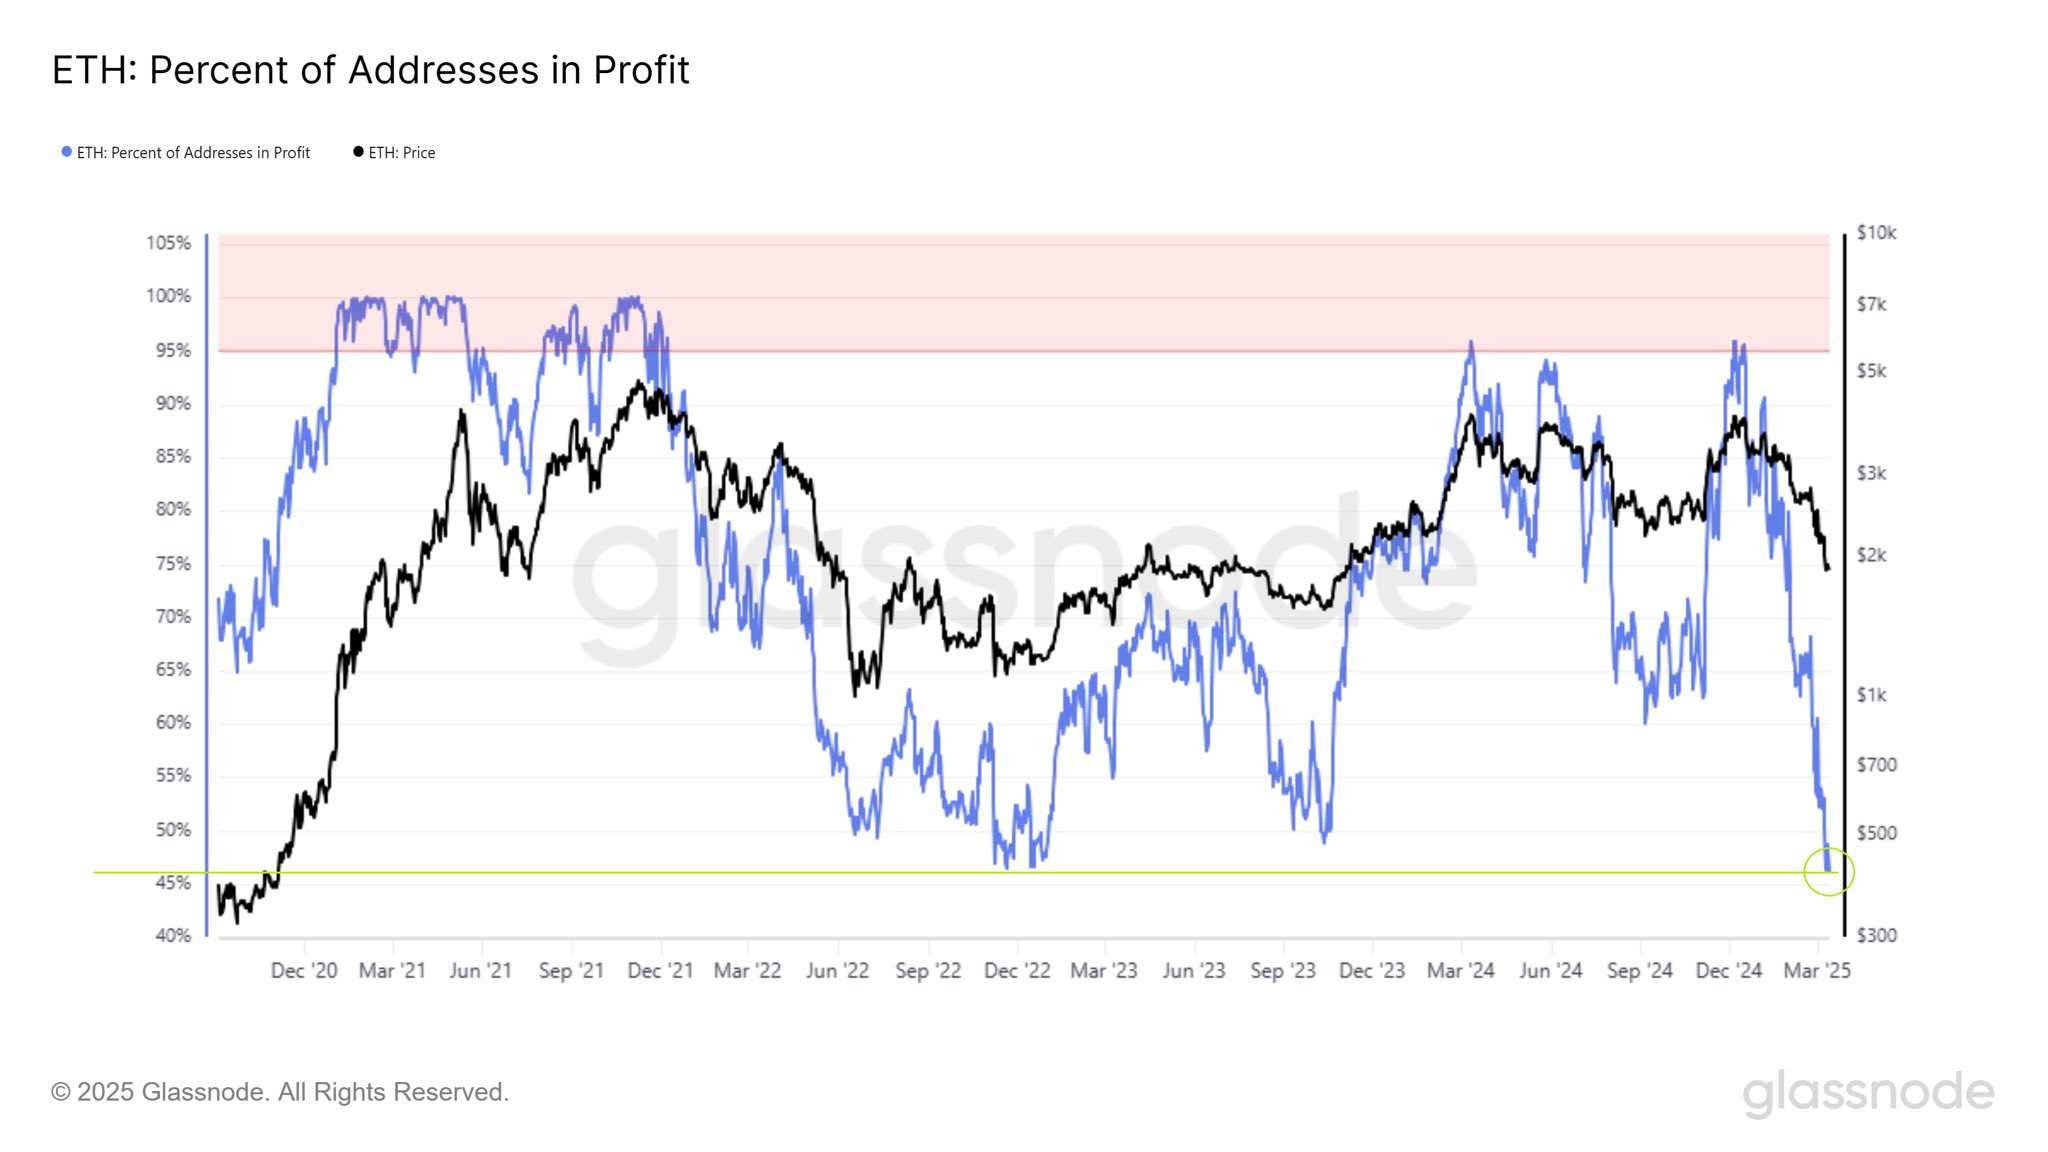
Source: Glassnode
A Supposed Whale has Been Shorting ETH on Extensive Leverage as Sentiment Hits Rock Bottom
Source: Coin World