
Source: Chip Bok, Reuters
As we turn the page on 2024, the last few sessions of the trading year turned out to be more consequential than expected. While the BoE and BoJ gave delivered ‘dovish holds’ as market expected, the Fed surprised markets with its own ‘hawkish hike’ along with a technical adjustment to the overnight reverse repo rate, signaling tightening liquidity conditions into year-end.
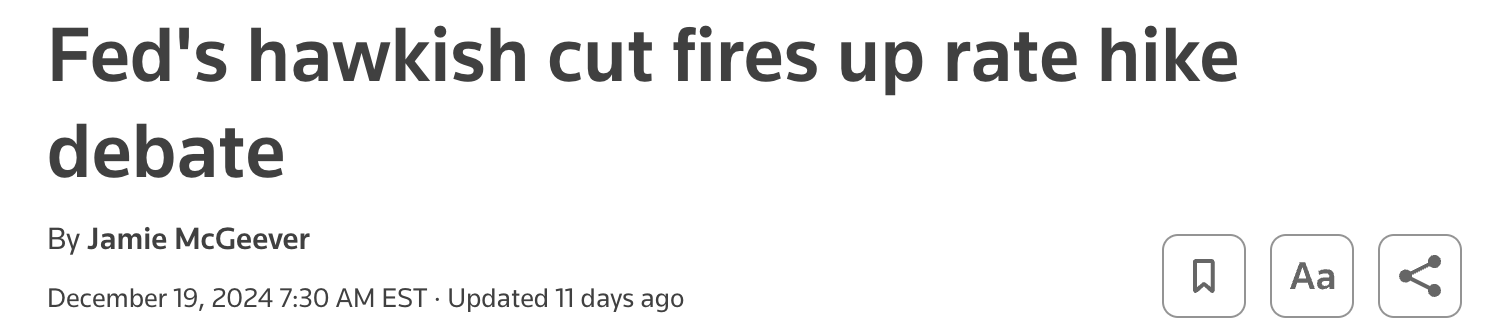
On the rate side, while Powell delivered an expected 25bp cut to bring Fed rates down to 4.50%, the delivery came attached with a full string of hawkish conditions, with a notable statement on “the extent and timing” with regards to future cuts, reminiscent to the language used during the 2006-07 pause. Clevent President Hammack also dissented with a preference to hold, and the SEP dots were similarly hawkish with only 5 members looking for >3 cuts in 2025. As such, the median dot has dropped to price in only 2 cuts next year versus 4 as recently as September, while the long-run rate has also risen to 3.0% with the economy remaining in good shape.
The Median ‘Dot-Plot’ Suggests Only 2 Rate Cuts in 2025 Versus 4 as Recent as September
Source: JPM
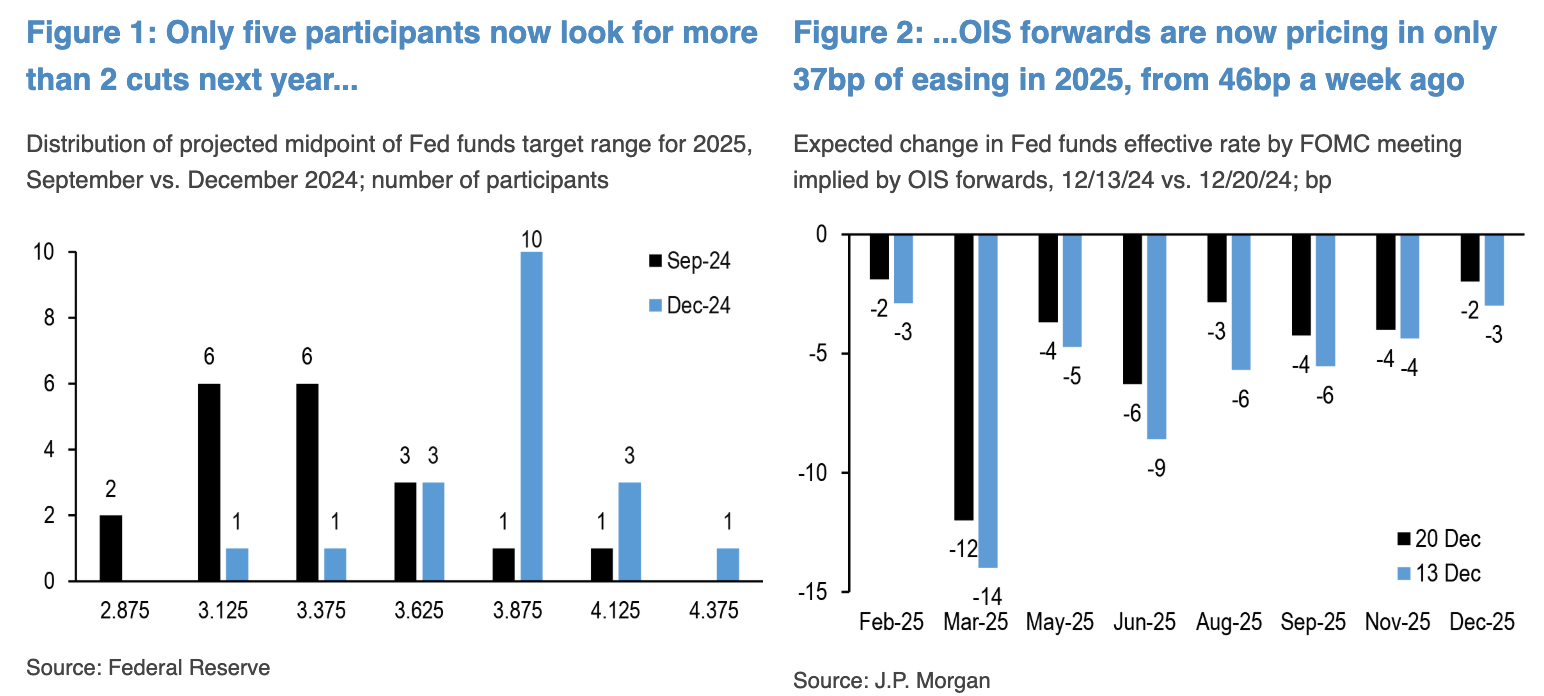
More importantly, median core PCE inflation for next year has also risen to 2.5% (+0.3%), and the ‘distribution of inflation risks’ has risen to 15 vs just 3 in September, underscoring the inflation stickiness we’ve seen over the past quarter. Furthermore, during the last FOMC Q&A of the year, Powell himself declared that he was “very optimistic” about the economy and that the Fed is now entering a new phase where it is “appropriate to move cautiously” after delivering 100bp of cuts. A hawkish pause indeed.
The Fed has Finally Acknowledged the Sticky Inflation Situation
Source: JPM
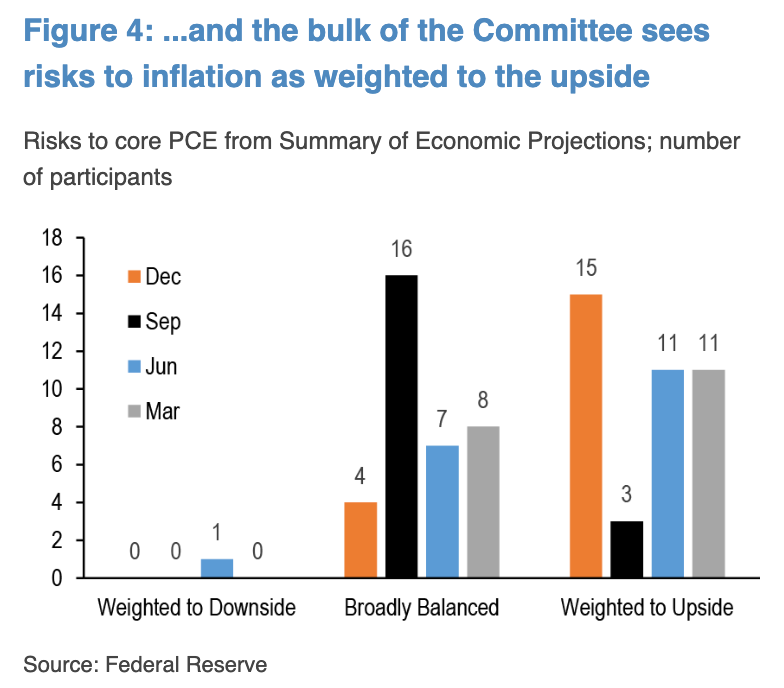
Markets are Singularly Expecting a ‘2-Cut’ Outcome in 2025 at Current Pricing
Source: JPM
On the fiscal side, Trump’s campaign proposals is estimated to increase the US deficit by $7.7T over the next 10 years (range of $1.7 to $15.5T as per the CRFB), which would take the US debt/GDP to ~145% by 2035. Ultimately, the degree of inflation pressure would depend on how many of these initiatives can be executed through his 2nd term, and Trump’s recent backtracking on the TikTok ban might suggest that the administration’s bite might be less than the bark?
Trumps’ Spending Plan Estimated to Add Around $8T to the US Deficit Over the Next Decade
Source: Citi
Is Trump’s Dramatic Pivoting on the Tik-Tok Ban a Sign of Actually Softer Geopolicies to Come?
Source: BBC
On the topic of government spending, the current debt ceiling suspension will expire on January 1st, and has prompted Yellen to embark on a number of ‘extraordinary measures’ to create more borrowing headroom in the meantime. By Wall Street estimates, the treasury should have enough emergency funding to last until August, so debt ceiling noise can headlines can probably be safely ignored until after Spring at the earliest.
Debt Ceiling Suspension will Expire on January 1st
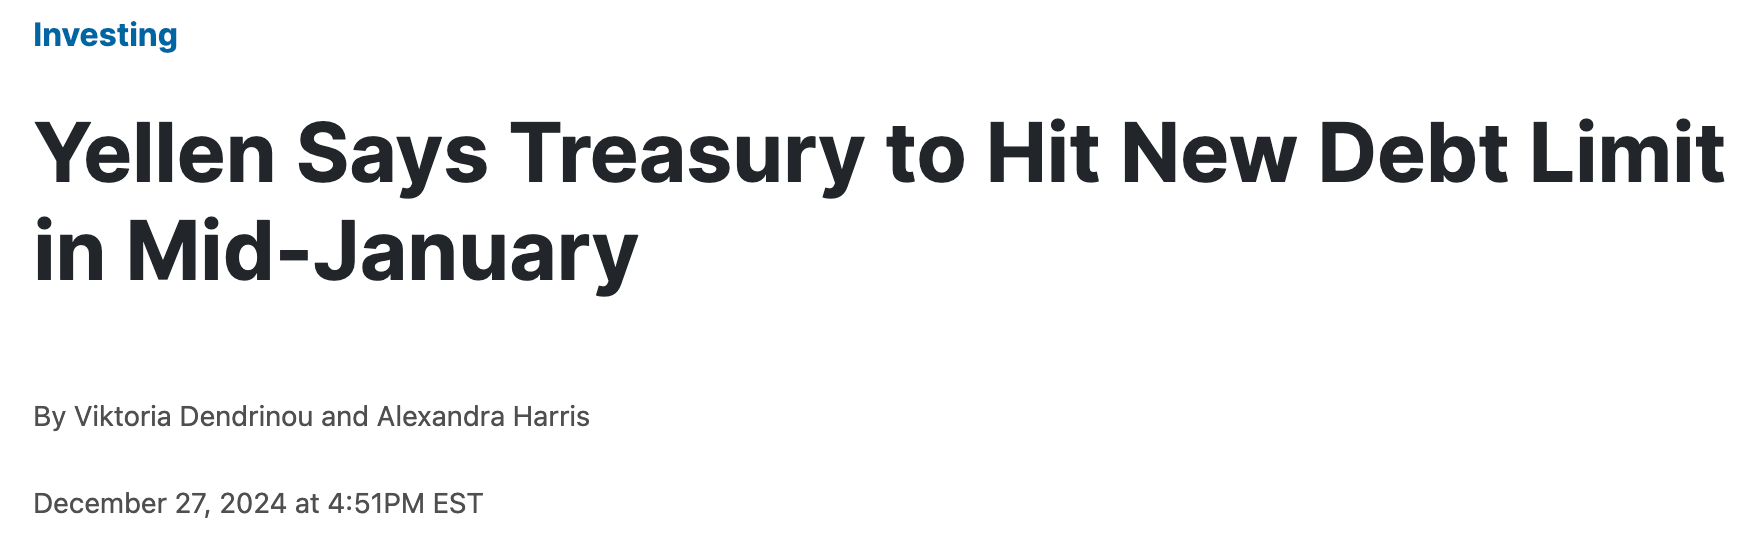
Source: Bloomberg
Though the Treasury Should have Enough Emergency Measures to Tie Over Borrowing Needs Until August
Source: Citi
The mix of hawkish headlines was a big risk-negative, leading to a 200pt correct in SPX and a bear steepening of the treasury curve. 10y yields have broken out of their downward channel and are heading towards the highs of the year, rising by nearly 15bp in the past week alone.
Treasury Yields have Resumed Their Hawkish Moves Higher Towards the Highs of the Year
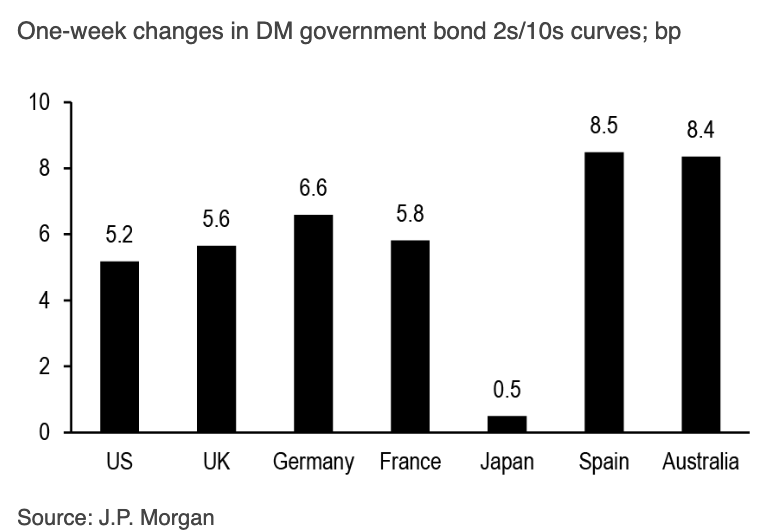
Source: Bloomerrg
The SPX saw a mini-crash following the FOMC with the VIX spiking higher by multiple standard deviations vs both fixed income vol as well as equity drawdowns. Index options saw significantly over-buying in call options right before the selloff, while equity indices saw a re-narrowing of leadership to even above the July levels, both likely playing a significant role in the VIX spike. The dramatic oversold conditions lead to a quick recovery over the past few days to just under the 6000 level, though the verdict is still out on whether we are out of the woods yet.
Equity VIX Spiked Dramatically Post the FOMC Disappointment
Source: Citi
Extreme Overbought Market Conditions Likely Contributed to the Unwinds
Source: Bloomberg
The purported ‘Santa Rally’ appears to have some significance as to how risk will start and end the year, as a negative final week tended to have led to preceded subsequent January sell-offs, not to mention a disappointing equity year on average. Will Santa decide to skip town again this year? We’ll find out in just a few more days…
Will Santa Decide to Skip Time This Year? It’s Looking Like a Close Call…
Source: Carson Research
Over onto crypto, 2024 was another one for history books, with crypto market cap rising by over 90% to grow from $1.65T to $3.2T YTD. Incredibly, crypto was the only asset class to outperform US equities on a market cap gain basis, spurred on by the introduction of spot ETFs in January and the regulatory optimism from President-Trump’s incoming crypto-friendly views.
Crypto was the Only Asset Class to See Its Market Cap Increase vs US Equities in 2024
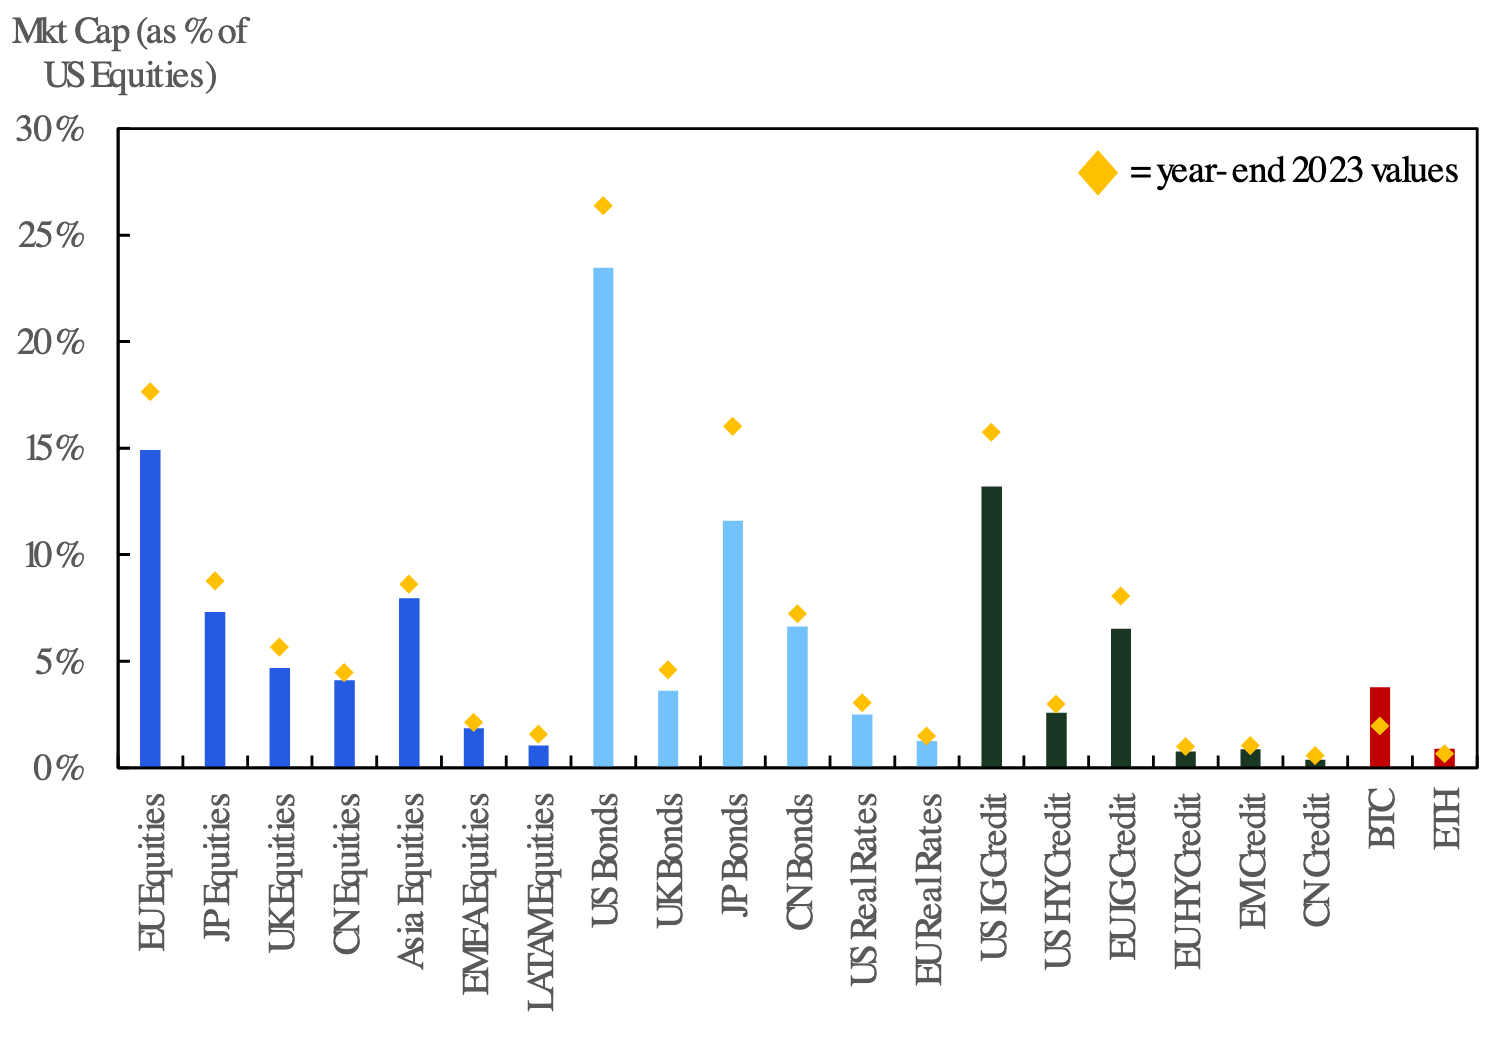
Source: Citi
Crypto Market Cap has Two Dramatic Jumps in 2024 with the Spot ETF Launch in January and Trump’s Election Win in November
Source: Citi
Crypto’s YTD gains were originally led by BTC and it’s resurging dominance, going from low ~40% to over 60% of total market cap in November 2024. On the whole, this year can also be characterized by a rough trimester of events; Q1 saw a significant rally led by the spot ETF approval, while Q2/Q3 saw a lull in activity and lack of follow through, which led to sideways markets. Finally, Trump’s re-election saw altcoins finally re-take leadership and driving the latest rally, with XRP and Dogecoin gaining well over 200% YTD, while other major altcoins also seeing ~150% rallies and leaving ETH’s 40% YTD gains in the dust.
BTC and Major Altcoins Saw 100-200% Rallies Across the Board, Leaving ETH and Its Related EVM Tokens in the Dust as Questions Remain Over Ethereum’s Long Term Value Proposition
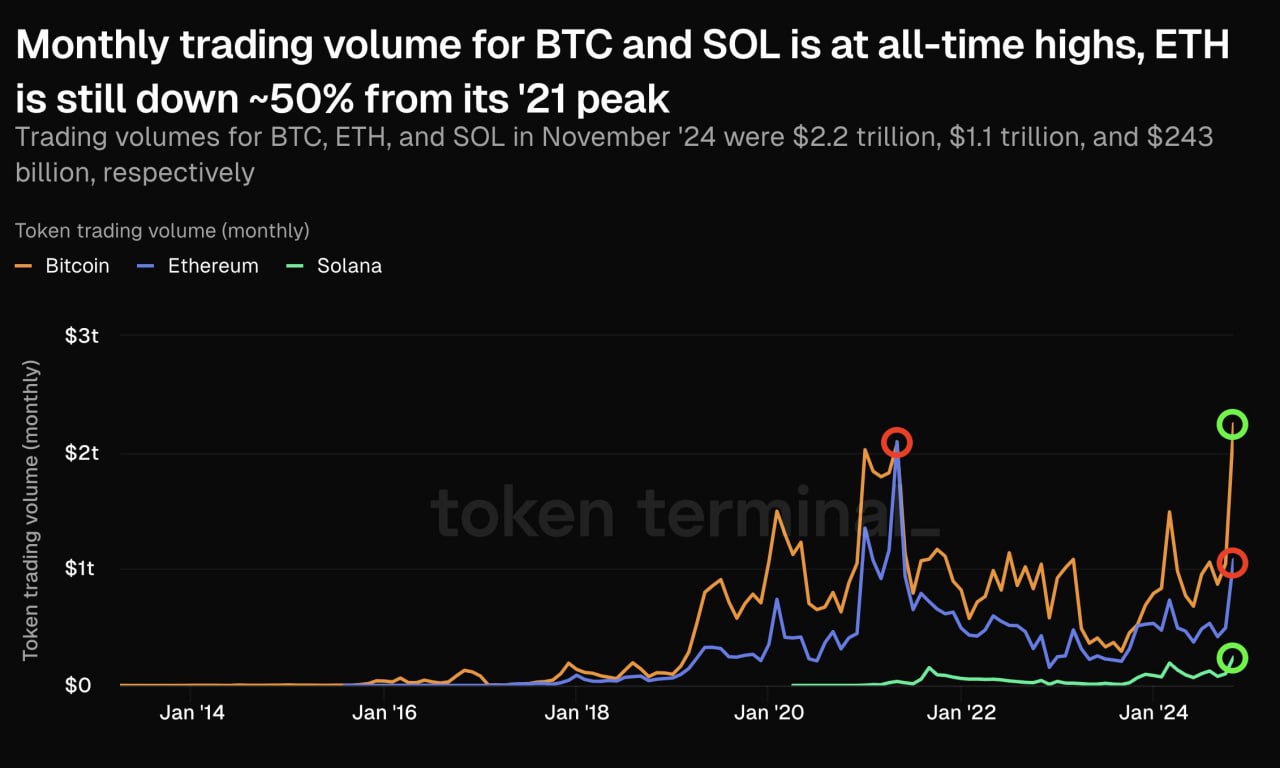
Source: Messari, Token Terminal
BTC Dominance has Been Rising All Year Thanks to TradFi Inflows, Up Until the Recent Altcoin Rally Over the Past 1.5 Months
Source: Citi
Mainstream’s effect on crypto is most evident through BTC’s high correlation to the SPX, remaining as the most correlated asset as we end 2024. Furthermore, studies from Citi show that ETF inflows have explained nearly half of the variance in weekly BTC returns, and have shown no signs of abating into the new year.
Equities Remain the Most Correlated Asset Class to BTC as We End 2024
Source: Citi
Furthermore, Net ETF Inflows are Suggested to Explain Nearly Half of the BTC Return Variance on a Weekly Basis
Source: Citi
Furthermore, in using stablecoin market cap as a proxy, mainstream has significantly ‘on-ramped’ back into crypto post the Trump election, with stablecoin market cap nearing $190B and well above the FTX peak seen in 2022. Rising talks of BTC reserves across global governments appear to be en vogue as well, with (unconfirmed) media headlines pointing to a HK lawmaker being the latest to suggest that the govt should consider Bitcoin as a part of the foreign asset portfolio.
Stablecoin Market Cap Smashed Above the Previous ‘FTX High’ as Mainstream Investors ‘On-Ramped’ Crypto in Significant Size
Source: Citi
HK Lawmaker Apparently the Latest Official to Suggest Including BTC as Part of the Government Portfolio (Unconfirmed)

Source: Binance
Another sign of BTC heading towards being a mainstream asset class is in its declining realized volatility, which would eventually add more diversification benefits and alpha to the traditional 60/40 portfolio. Volatility should continue to decline as an asset class matures, as our long-standing view is that crypto would be no different.
BTC Realized Volatility Continues to Decline as It Matures as an Asset Class
Source: Citi
In closing, we leave our readers with an unresolved chart on BTC and M2, suggesting some contrarian caution in the BTC rally as global liquidity continues to decline. Will the continued inflow of new TradFi money and crypto-friendly US regulations lead to a step-function break in the correlation? Or will macro factors override and the doubters be correct that BTC is still just another liquidity expression?
Thank you everyone for a fantastic 2024, and we look forward to sharing more crypto-macro thoughts in the new year! Happy holidays!
Will History Repeat Itself? Or Will This Time Be Very Different Indeed?
Source: Bloomberg